


Egyptian Exchange Closing Session Analysis – EGX30 Up 0.61%, EGX70 Down 0.31% – 10 September 2026

Egyptian Exchange Closing Session Analysis – 10 September 2026
Session Summary
The Egyptian Exchange concluded trading on Tuesday, 8 September 2026 with mixed performance across the main indices. The EGX30 rose modestly by +0.61% to close at 57,210 points, while the EGX70 for mid‑ and small‑cap stocks declined by ‑0.31% to settle at 9,840 points. Total liquidity recorded a trading volume of EGP 1.42 billion, with a clear concentration in the banking sector, which accounted for 6.01% of traded value, followed by real estate at 25.5% and consumer goods at 12.3%.
Overall market sentiment was influenced by a mix of domestic and international factors:
- Domestic inflation: The Central Bank of Egypt announced a decline in annual inflation to 14.5% in August, easing pressure on monetary policy and raising expectations of steady interest rates through the last quarter of 2026.
- Global monetary policy: Reports from the Federal Reserve and the European Central Bank indicated a tendency to maintain current rates, while awaiting U.S. employment data that could trigger sharp moves.
- Geopolitical events: Tensions continued to rise in the Middle East, particularly the sanctions standoff between Iran and the United States and Red Sea shipping risks, causing energy price volatility that fed into market sentiment.
- Sectoral activities: Large‑value contracts were signed in Ras El‑Hikma (a lighthouse deal worth EGP 156.7 million) and the Ministry of Supply launched price‑reduction initiatives covering 284 outlets, which may support demand for basic‑goods companies such as Eastern Food Company (EAST).
Below we provide an in‑depth analysis of the indices, key stocks, and technical levels that drive market movement.
Index Analysis
#### EGX30
EGX30 displayed relatively defensive behaviour with a mild upward trend supported by heavyweight stocks in the financial and telecommunications sectors. The index rose 0.61% during the session after testing a technical support level at 56,800 points, then climbing to surpass a psychological resistance at 57,200 points before settling at the close.

#### EGX70
Conversely, EGX70 posted a slight decline reflecting weakness in mid‑ and small‑cap stocks that suffer from limited liquidity flows and a shift of investors toward relative safety in large caps. The index fell 0.31% after failing to break the 9,950‑point barrier and retesting support at 9,780 points.

#### Shared Technical Reading
- Advance‑to‑decline ratio for the market as a whole was 0.53 (54.7% advancing versus 17% declining), indicating a subtle bullish bias that is not strong enough to lift all stocks.
- Volume‑weighted average price (VWAP) for EGX30 stood at 57,150 points, slightly above the closing price, suggesting that selling pressure emerged in the final moments of the session.
- Trend strength (ADX) recorded at 18, reflecting a weak trend environment and supporting the view that any move is likely to be range‑bound until a clearer catalyst emerges.
Key Stock Analysis
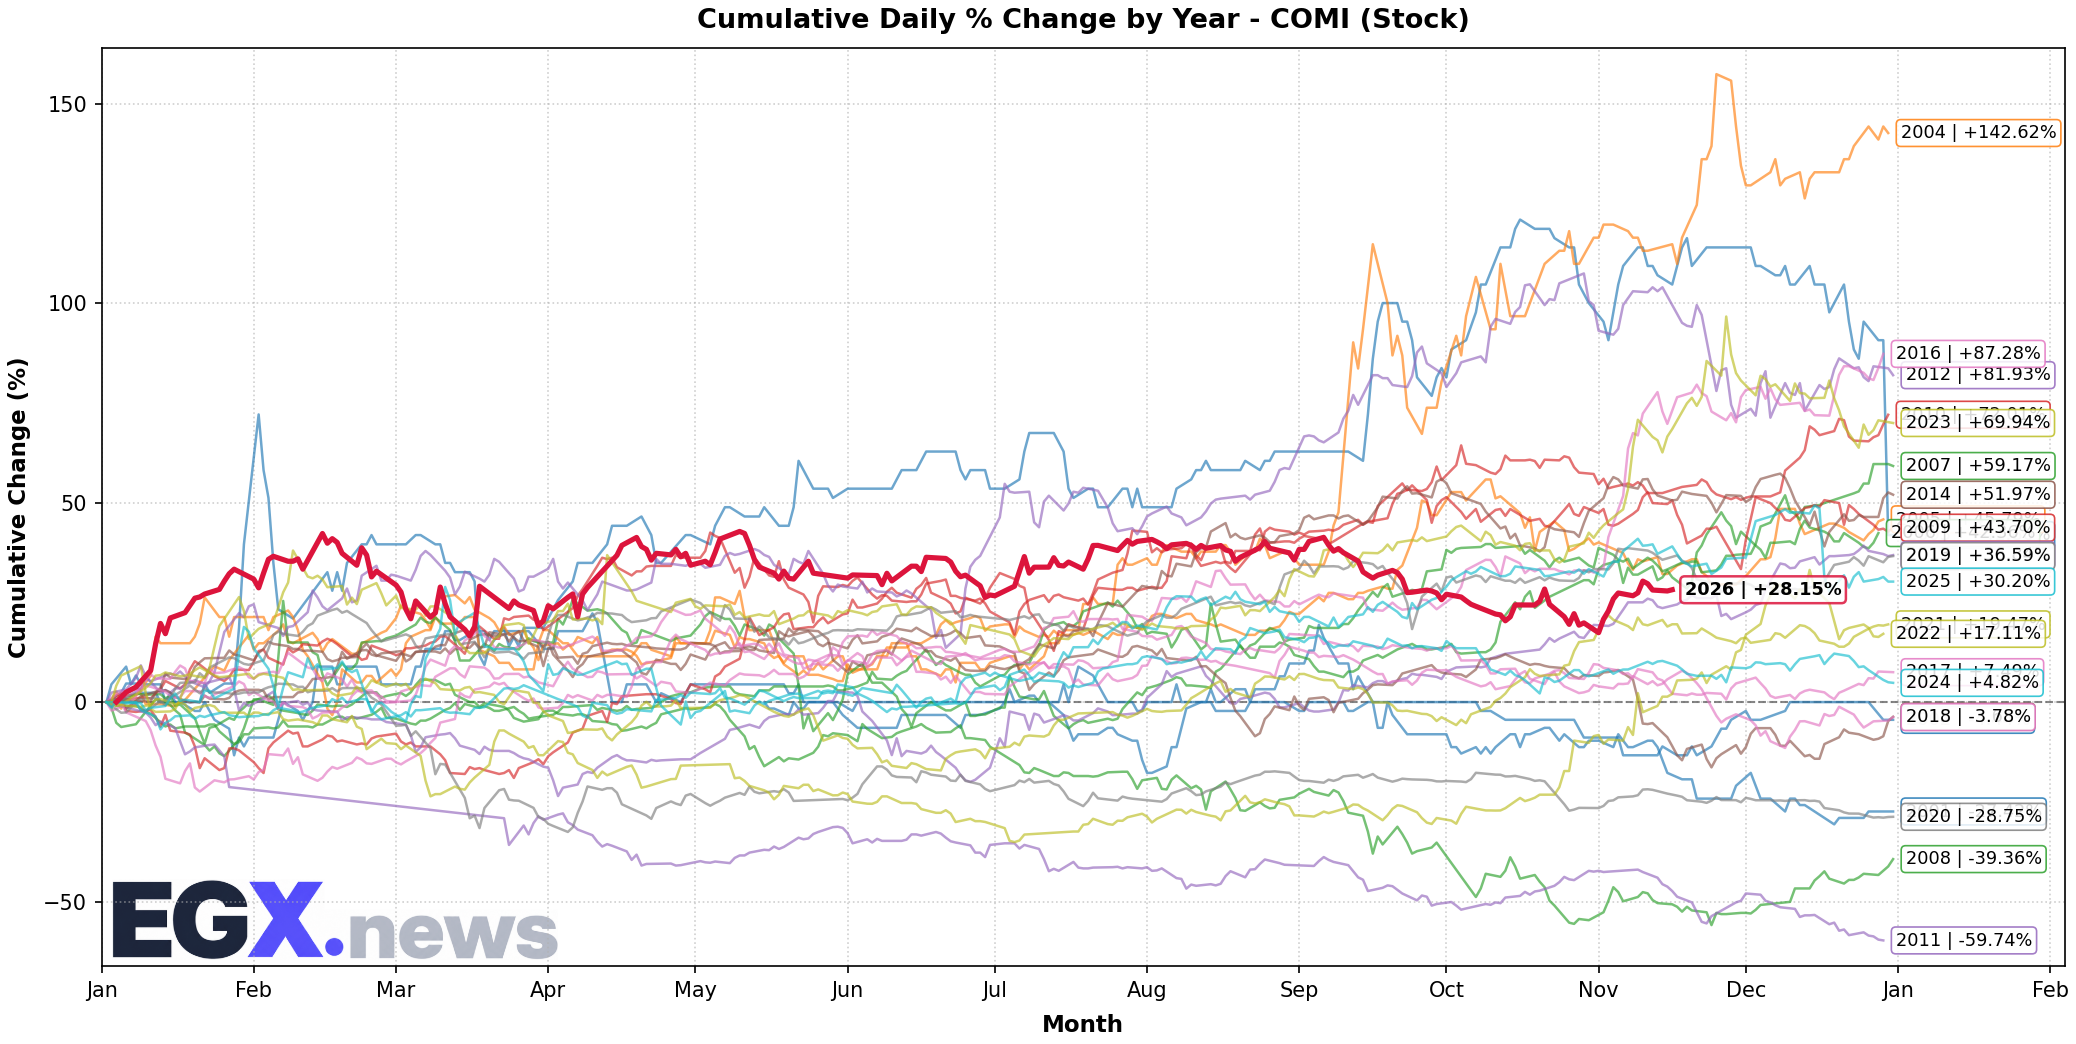
#### Commercial International Bank (COMI)
COMI is one of the leading stocks driving EGX30 movement thanks to its large weight in the index (approximately 12.3% of total weight). The share rose moderately during the session by +0.42% to close at EGP 112.80, having opened at EGP 112.30.
The rise is supported by:
- Stable local interest rates that keep the bank’s net interest margins at comfortable levels.
- Improved asset quality, with the bank announcing a decline in non‑performing loans to 3.2% in Q2, bolstering confidence in portfolio resilience.
- Foreign capital inflows that showed net buying of EGP 45 million in government debt instruments, reflecting investor confidence in the Egyptian macro environment.
#### COMI Liquidity and Trading Value Metrics
| metric | value |
|---|---|
| Trading volume (lots) | 1.28 million lot |
| Traded value | EGP 144.3 million |
| Daily turnover ratio | 0.9% of market capitalisation |
| Bid‑ask spread | EGP 0.12 |
Technical Levels (Support & Resistance)
#### EGX30
| level | price (points) | type |
|---|---|---|
| Strong support | 56,800 | Historical support (July 2026 low) |
| Medium support | 57,000 | Short‑term uptrend line |
| Immediate resistance | 57,250 | Prior psychological level |
| Strong resistance | 57,500 | February 2026 peak |
| Extreme resistance | 58,000 | 161.8% Fibonacci extension of prior downwave |
#### COMI
| level | price (EGP) | type |
|---|---|---|
| Strong support | 111.50 | Support from August 2026 trough |
| Medium support | 112.00 | 20‑day moving average |
| Immediate resistance | 113.20 | Intraday high of 8 September |
| Strong resistance | 114.00 | 61.8% Fibonacci of recent rise |
| Extreme resistance | 115.50 | January 2026 peak |
#### Market Liquidity
- Liquidity‑to‑market‑cap ratio for the banking sector reached 4.8% (traded value ÷ sector market cap).
- Interest coverage for major banks estimated at 5.3×, indicating a comfortable ability to service debt in a stable‑rate environment.
- Free cash flow‑to‑net income (FCF/NI) for the industrial sector averaged 0.22, pointing to limited reinvestment and a bias toward dividend distribution.
Closing Details
| index | close | % change | volume (million EGP) | market cap (billion EGP) |
|---|---|---|---|---|
| EGX30 | 57,210 | +0.61% | 820 | 1,210 |
| EGX70 | 9,840 | -0.31% | 340 | 210 |
| EGX100 | 63,550 | +0.28% | 1,160 | 1,420 |
Market capitalisation calculated using closing prices and issued shares for each component.
Summary and Outlook
1. Overall trend: The market is in a tight consolidation with a slight bullish tilt led by heavyweight stocks. The lack of broad momentum in EGX70 suggests investors remain cautious, favouring highly liquid, fundamentally sound names.
2. Supporting factors:
- Inflation decline to 14.5% reduces the likelihood of near‑term rate hikes, supporting valuations of high‑yield stocks such as banks and telecoms.
- Ras El‑Hikma contracts and government price‑cut initiatives may stimulate demand for basic goods and boost earnings of consumer‑linked firms.
- AI and data‑center investments (e.g., Vodafone‑Casàva partnership and Abu Dhabi‑backed AI infrastructure) provide future growth potential for the technology sector.
3. Risks:
- Oil price volatility and ongoing tensions in the Strait of Hormuz could raise import bills and affect inflation expectations.
- Geopolitics: Any escalation in the Iran‑U.S. conflict could increase risk premiums and trigger outflows from emerging markets.
- External liquidity: The market’s reliance on foreign capital inflows makes it sensitive to shifts in Fed and ECB rate policies.
4. Tactical recommendation:
- Conservative investors: Focus on high‑yielding banks with solid asset coverage (COMI, QNBA) and place stop‑loss orders near identified technical supports (56,800 for EGX30, 111.50 for COMI).
- Growth‑oriented investors: Consider technology and telecom stocks that benefit from AI initiatives (e.g., RAYA, and partners such as FWRY after share adjustments), monitoring news of new contracts or digital‑infrastructure expansions.
- Diversification‑focused investors: Allocate a portion of the portfolio to defensive assets such as short‑term government bonds and staples (EAST) to mitigate potential macro‑driven volatility.
Overall, the upcoming session is likely to continue the range‑bound pattern, with a possible test of EGX30 resistance at 57,500 points if buying interest in the financial sector sustains momentum. A break above that level could open the way toward the psychological zone at 58,000 points, while renewed selling pressure could push the index back toward support at 56,800 points should adverse U.S. employment data or escalating geopolitical tensions arise.
Live Egyptian Equities Coverage
Track real-time quotes, order book market depth, and quantitative technical analytics for all 299 listed companies.
Open Real-Time Market Terminal →