


e-finance
EFIHe-finance for Digital and Financial Investments S.A.E.
Company Overview & Activities
تقديم الدعم الفني والمالي والإداري للشركات التي تساهم بها الشركة والتي تعمل في التحول الرقمي ومساندتها في تنمية حجم أعمالها. تقديم خدمات التشغيل المتخصصة لأنظمة تكنولوجيا المعلومات والاتصالات سواء داخل جمهورية مصر العربية أو خارجها (فيما عدا منطقة شبه جزيرة سيناء يلزم موافقة الهيئة مسبقاً) وتشمل هذه الخدمات ما يلي: 1.إدارة وتشغيل وصيانة كافة الأجهزة ومعدات وشبكات الحاسب الآلي. 2.إنتاج وإصدار وطباعة وتغليف وإدارة وتشغيل نظام للبطاقات الذكية. 3.إدارة وتشغيل التطبيقات الخاصة بتقديم الخدمات البنكية من خلال الهاتف ومن خلال شبكة الانترنت وخدمات الدفع الكتروني وتداول الوثائق المؤقتة الكترونيا. 4.إقامة وإدارة وتشغيل أنظمة وإدارة مراكز خدمة العملاء من خلال الهاتف، وتنفيذ وإدارة وتشغيل الشبكات والحاسبات المركزية والأنظمة الداخلية للبنوك 5.إنشاء وإدارة مراكز التدريب لإعداد الباحثين ومراكز نقل تكنولوجيا المعلومات. 6.التدريب على تشغيل وإدارة وصيانة الحاسب الآلي ونظام البطاقات والتطبيقات الخاصة بتقديم الخدمات البنكية ومراكز خدمة العملاء والتطبيقات الخاصة بخدمات الدفع الالكتروني. 7.ح
EGS743O1C013
2021-10-04
FRA Certified Auditor
Financial FAQ & Technical Outlook for e-finance for Digital and Financial Investments S.A.E. (EFIH)
Quantitative Technical Engine (EFIH)
e-finance holds a Very Bullish technical posture (Overall Score: 85.5/100) with Trend Score 80/100, Momentum Score 100/100 (RSI 61.09 - Strong Bullish Momentum), and Volume Score 70/100 (accumulating, 0.5x 20D baseline).
Support & Resistance Confluence Matrix
AlgorithmicNearest support is at 24.84 [Strength: 45.0/100, Tier 3 (Intraday 1-min)] (0.24% below price with a 100.0% confirmed bounce rate across 1 tests, Reliability: Low). Nearest resistance is at 25.0 [Strength: 65.0/100, Tier 3 (Intraday 1-min)] (0.4% above price with a 100.0% confirmed rejection rate across 16 tests, Reliability: High).
Seasonal Trend & Historical Patterns (EFIH)
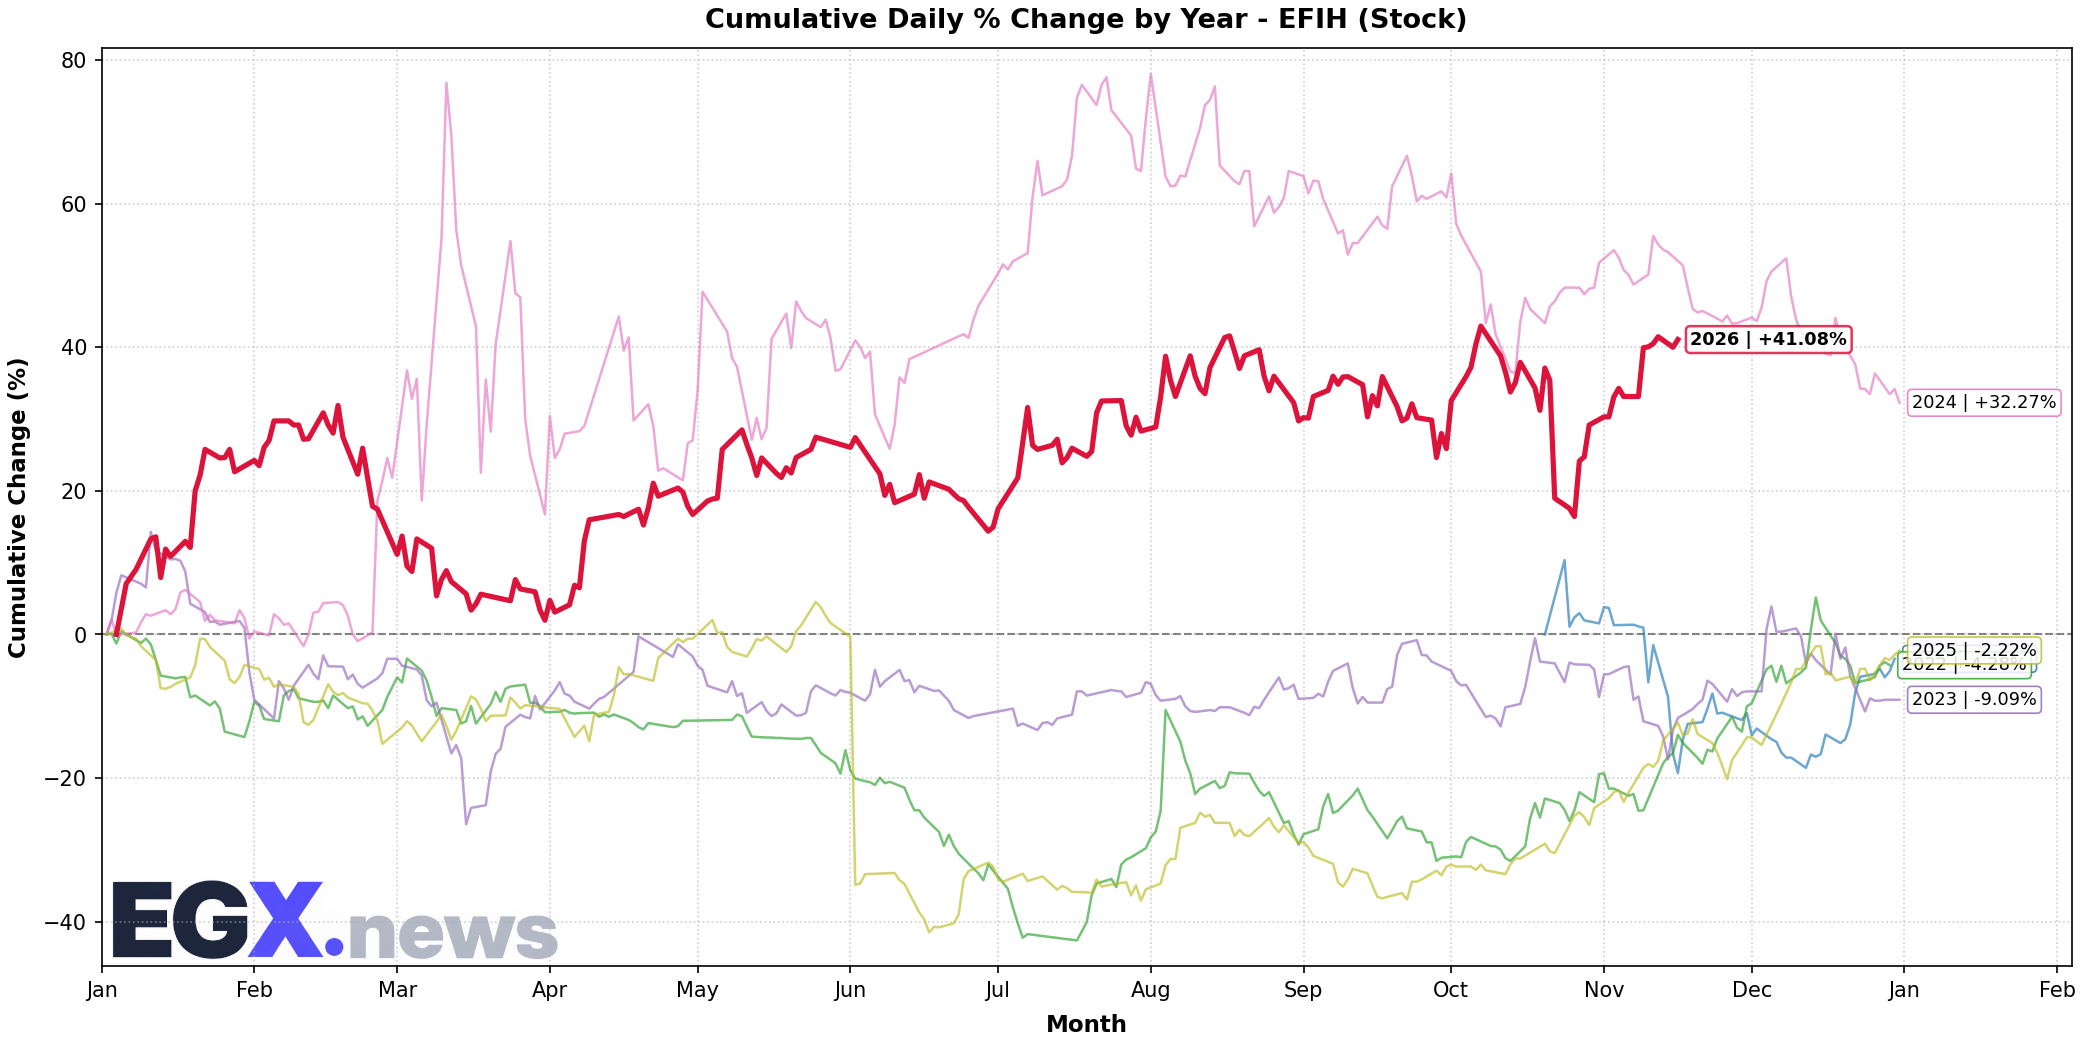
Click to EnlargeHistorical monthly seasonal return distribution and performance cycles for EFIH.
Trend Structure & Moving Averages
Golden Cross (213D)Trend Score is 80/100 with price trading 6.82% above its 20-day SMA and above the 200-day long-term benchmark (SMA50 is above SMA200 for 213 sessions).
Momentum, Volume Flow & Volatility
RSI(14) is 61.09 (Strong Bullish Momentum), moving +0.28 over the past 5 sessions — confirming powerful bullish upward pressure. MACD line (0.442) is above signal line (0.206) with a histogram of +0.235 (Bullish Momentum).
20-day annualized volatility is 58.65%, ATR(14) is 0.99 (3.98% of price), and price is trading in the middle channel (%B: 0.78, Bandwidth: 24.41%).
Statistical Backtests & Historical Win Rates
BacktestedEmpirical backtesting reveals that RSI oversold dips (<30) historically yield an average 20-day return of +5.11% with a 61.11% win rate (18 observations, Reliability: Low), while volume spikes yield an average 20-day return of +1.25% (45.83% win rate).
Price sits 8.39% below All-Time High (27.18 set 630 sessions ago on 2024-03-12) and 1.97% below its 52-week high (25.4 on 2026-08-17).