


Abu Dhabi Islamic Bank-Egypt
ADIBAbu Dhabi Islamic Bank-Egypt
Company Overview & Activities
مباشرة كافة اوجه النشاط المصرح بها للبنوك التجارية بالعملات المصرية والاجنبية بما في ذلك ودون تحديد ما يتعلق بجميع الاعمال المصرفية التجارية وتمويل التجارة الخارجية وعمليات النقد الاجنبى وكذلك بحث وتمويل وتأسيس والمشاركة في مشروعات التنمية في القطاعات المختلفة سواء كانت مشروعات محلية أو مشتركة أو اجنبية0
EGS60111C019
1996-06-19
FRA Certified Auditor
Financial FAQ & Technical Outlook for Abu Dhabi Islamic Bank-Egypt (ADIB)
Quantitative Technical Engine (ADIB)
Abu Dhabi Islamic Bank-Egypt holds a Neutral technical posture (Overall Score: 56.0/100) with Trend Score 50/100, Momentum Score 90/100 (RSI 51.8 - Bullish Momentum), and Volume Score 35/100 (distributing, 0.6x 20D baseline).
Support & Resistance Confluence Matrix
AlgorithmicNearest support is at 48.6 [Strength: 45.0/100, Tier 3 (Intraday 1-min)] (0.33% below price with a 100.0% confirmed bounce rate across 1 tests, Reliability: Low). Nearest resistance is at 48.89 [Strength: 60.5/100, Tier 3 (Intraday 1-min)] (0.27% above price with a 81.8% confirmed rejection rate across 22 tests, Reliability: High).
Seasonal Trend & Historical Patterns (ADIB)
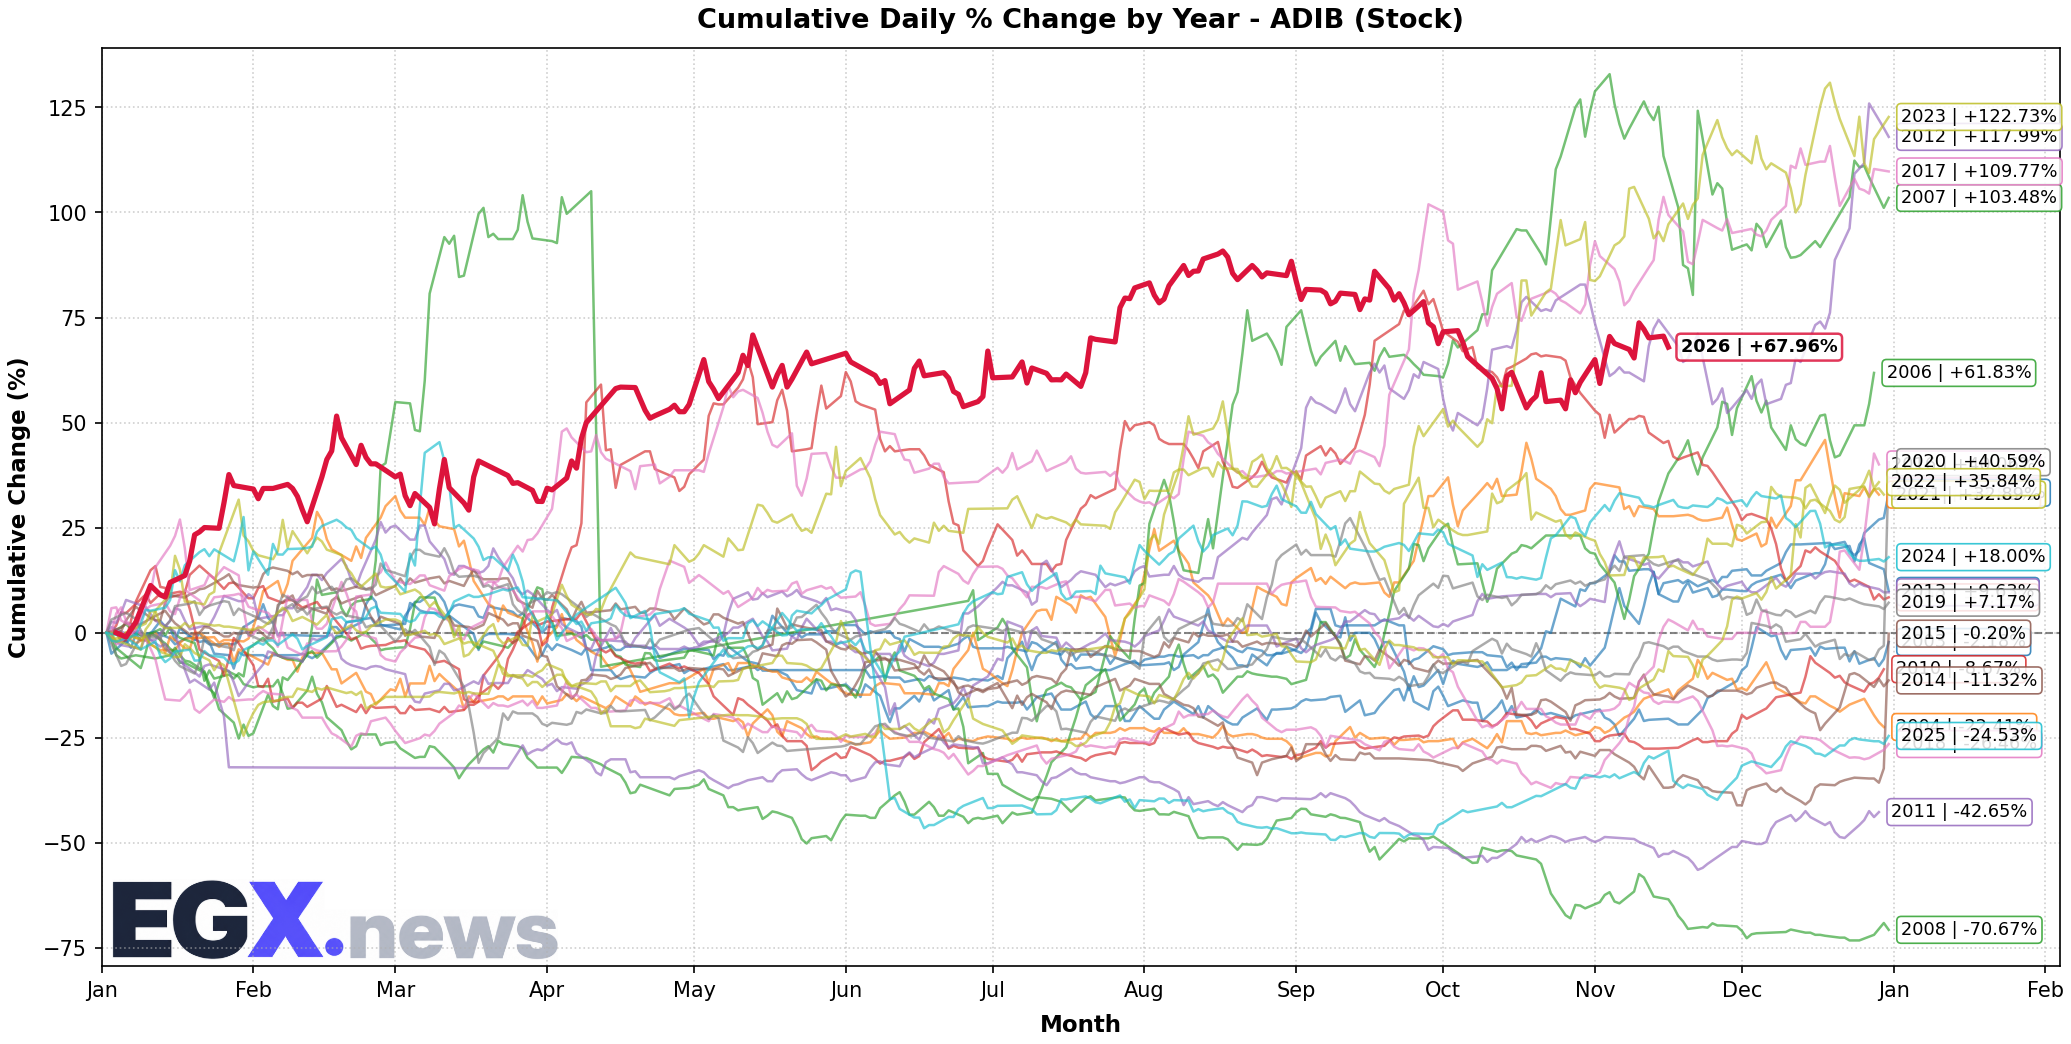
Click to EnlargeHistorical monthly seasonal return distribution and performance cycles for ADIB.
Trend Structure & Moving Averages
Golden Cross (189D)Trend Score is 50/100 with price trading 2.57% above its 20-day SMA and above the 200-day long-term benchmark (SMA50 is above SMA200 for 189 sessions).
Momentum, Volume Flow & Volatility
RSI(14) is 51.8 (Bullish Momentum), moving +0.82 over the past 5 sessions — indicating positive momentum in buyer territory. MACD line (0.37) is above signal line (0.012) with a histogram of +0.358 (Bullish Momentum).
20-day annualized volatility is 42.54%, ATR(14) is 1.65 (3.38% of price), and price is trading in the middle channel (%B: 0.665, Bandwidth: 15.63%).
Statistical Backtests & Historical Win Rates
BacktestedEmpirical backtesting reveals that RSI oversold dips (<30) historically yield an average 20-day return of +2.98% with a 62.96% win rate (108 observations, Reliability: High), while volume spikes yield an average 20-day return of +3.60% (55.76% win rate).
Price sits 12.38% below All-Time High (55.65 set 63 sessions ago on 2026-08-17) and 12.38% below its 52-week high (55.65 on 2026-08-17).