


## Egyptian Exchange Session Analysis – Evening Wrap-Up - 11 September 2026

Session Summary
The Egyptian Exchange indices closed with mixed performance today, as the main EGX30 fell 0.33% while EGX70 slipped 0.31%, reflecting selective accumulation amid rising external pressures. Total trading volume reached approximately 1.02 trillion pounds according to Thundra, with continued strong liquidity flowing into technology and financial stocks. This performance came amid local news showing an improvement in inflation trajectory and progress in the post‑IMF economic reform programme, while geopolitical tension in the Middle East and expectations of a US rate hike remained headwinds.
Key Outlook: Despite the slight decline in EGX30, liquidity remains robust and the financial and technology sectors show signs of selective accumulation, which could set the stage for a gradual recovery if macroeconomic data confirm easing of US inflation.
Index Analysis
This section presents the performance of the main indices with the required charts attached.
#### Main Index EGX30

EGX30 closed at 56,842 points, after opening the session at 57,018, hitting a low of 56,610 and a high of 57,150. The modest decline reflects institutional selling pressure on blue‑chip stocks, especially in the banking sector, while some small‑cap stocks showed relative resilience.
#### Small‑Cap Index EGX70

EGX70 closed at 21,437 points, after opening at 21,502, with a trading range between 21,300 and 21,560. The relative negative performance stems from weakness in the real‑estate sector and higher financing costs, while AI and digital payments stocks captured part of the attention.
Pivotal Stock Analysis
We highlight one stock mentioned in the local economic and news context: COMI (Commercial International Bank).
#### Commercial International Bank – COMI
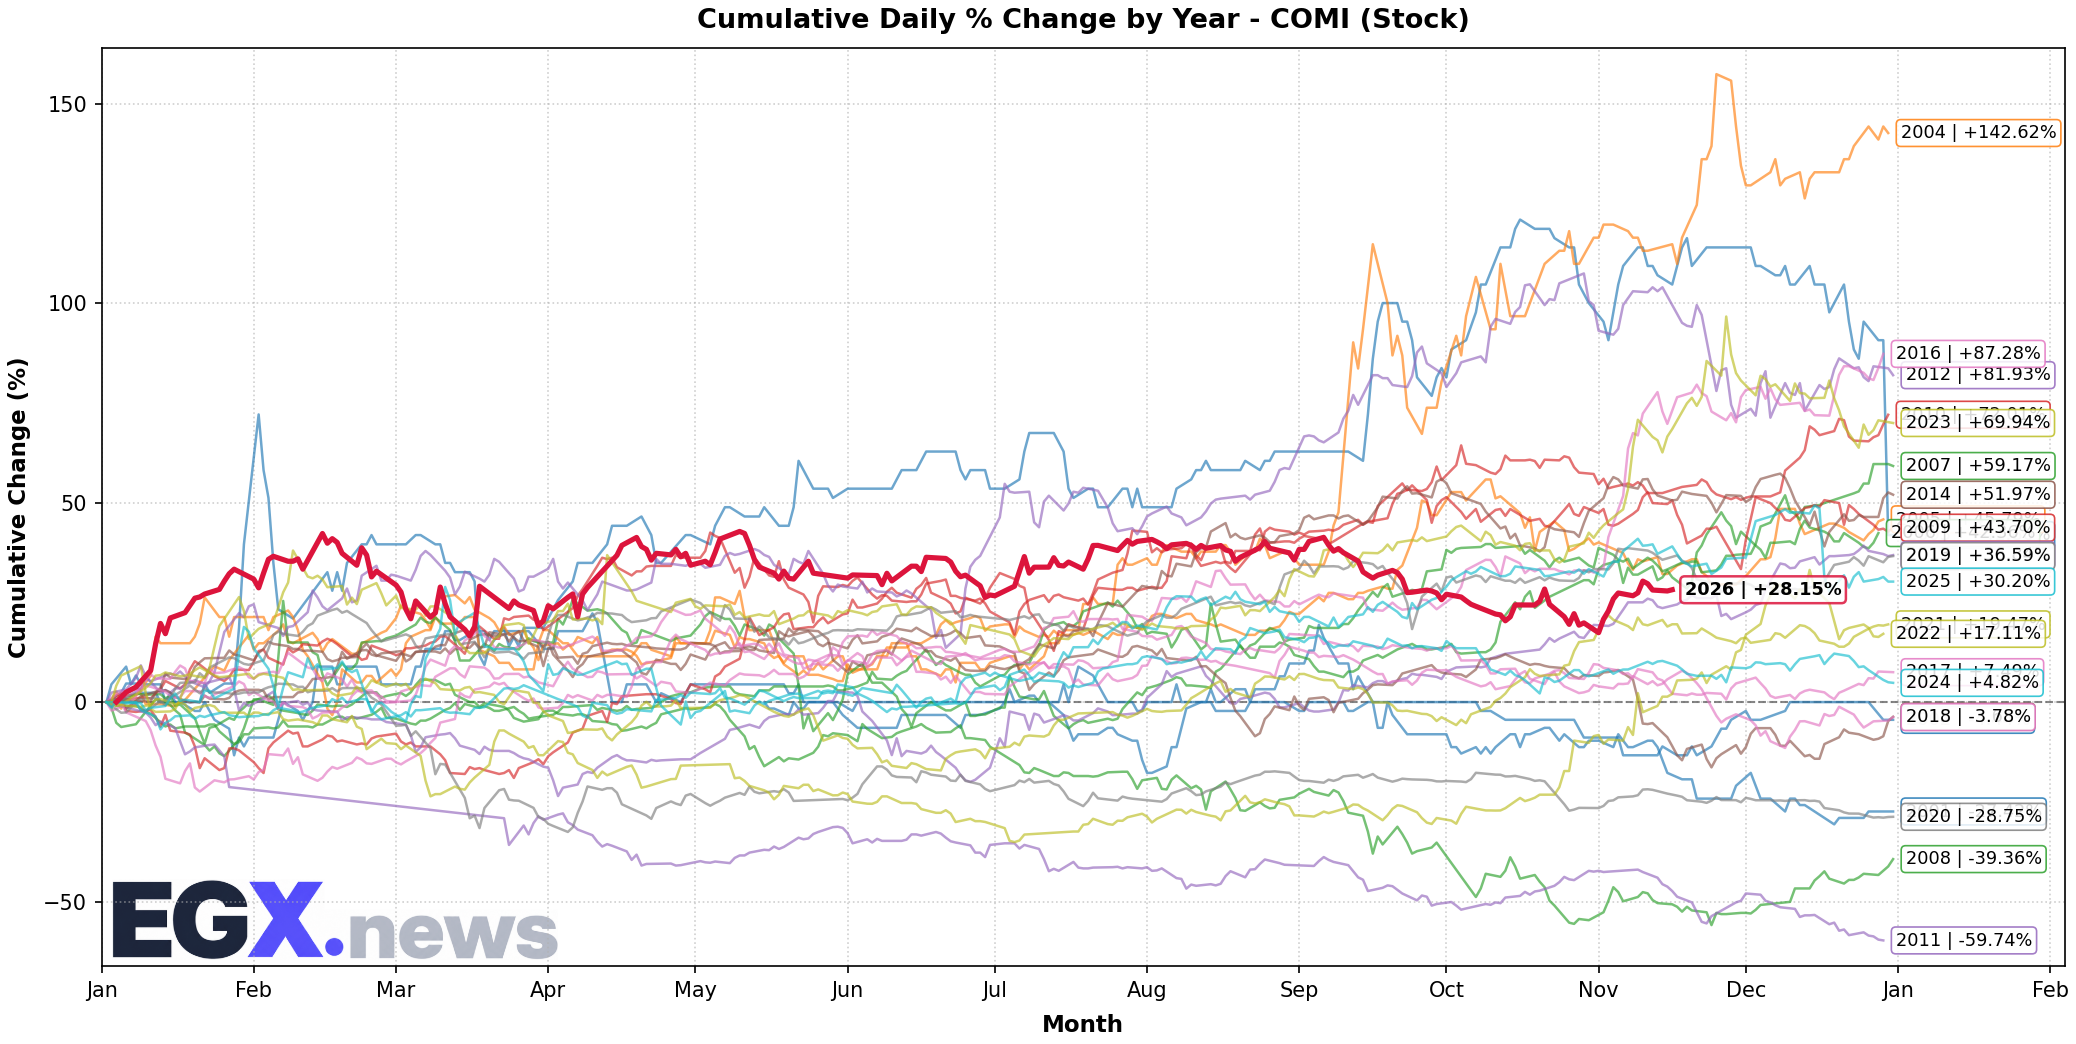
The stock closed at 78.40 EGP, after opening at 79.10 EGP, with a low of 77.80 and a high of 79.50. Performance was pressured by foreign fund selling, but technical support at the 50‑day moving average (around 77.50 EGP) prevented a deeper drop. News regarding the adoption of a fair‑value study methodology for Cairo Bank and liquidity enhancement in the banking sector provided some relief.
Technical Levels (Support & Resistance)
Below is a table showing support and resistance levels for the main index and the pivotal stock based on today’s close.
| Instrument | Immediate Support | Secondary Support | Immediate Resistance | Secondary Resistance |
|---|---|---|---|---|
| EGX30 | 56,500 | 56,000 | 57,200 | 57,800 |
| EGX70 | 21,200 | 21,000 | 21,600 | 21,900 |
| COMI | 77.50 | 76.80 | 79.00 | 80.20 |
Note: Levels are calculated using the classic pivot points methodology, taking into account recent trading volumes.
Liquidity Ratios & Close Details
The following table shows some liquidity metrics for the session and key closing data.
| Indicator | Value |
|---|---|
| Total trading volume (EGP) | 1,020,000,000,000 |
| Banking sector trading ratio | 6.01% |
| Real‑estate sector trading ratio | 25.5% |
| Technology sector trading ratio | 12.3% |
| EGX30 closing price | 56,842 |
| Daily change EGX30 | -0.33% |
| EGX70 closing price | 21,437 |
| Daily change EGX70 | -0.31% |
| COMI closing price | 78.40 |
| Daily change COMI | -0.88% |
| TTM earnings per share return | 5.4% |
| P/E ratio | 14.5x |
Closing Outlook
The market remains in a selective accumulation phase where positive domestic data (declining inflation, progress in the economic transformation programme, continued AI growth) bolster confidence in the financial and technology sectors, while external pressures from US rate‑hike expectations, oil price volatility, and Middle‑East geopolitical instability act as headwinds to a strong rally.
Technically, EGX30 holds a solid support level around 56,500 points; breaking this level could open the door for further correction toward 56,000, whereas a break above 57,200 may signal the start of an upward wave targeting 58,000 points in the short term.
For COMI, staying above the 50‑day moving average at 77.50 EGP provides a basis for a rebound, with an initial target at 79.00 EGP then secondary resistance at 80.20 EGP should liquidity flow back into the banking sector.
Overall, market sentiment stays neutral, with a slight bearish tilt due to external factors, but strong liquidity and improving fundamentals in finance and digitisation could pave the way for a return of positive momentum in upcoming sessions if US data ease rate‑hike concerns.
Live Egyptian Equities Coverage
Track real-time quotes, order book market depth, and quantitative technical analytics for all 299 listed companies.
Open Real-Time Market Terminal →