


## Egyptian Exchange Closing Session Analysis - 13 September 2026

Daily Performance Overview
The Egyptian Exchange closed with mixed performance, as the main index EGX30 fell 0.33% to close at 56,820 points, while the small‑ and mid‑cap index EGX70 rose 0.38% to 2,145 points. Total trading value amounted to roughly 11 billion Egyptian pounds, with a clear focus on mid‑ and small‑cap stocks benefiting from investment flows directed toward technology and industrial sectors.
Key observation: Liquidity remains robust, and the shift of activity from EGX30 to EGX70 indicates an investment rotation favoring high‑growth stocks with strong balance sheets amid a volatile global interest‑rate environment.
---
Index Analysis
EGX30 – Main Index

- Close: 56,820 points (−0.33%)
- Daily range: 56,540 – 57,100 points
- Volume: 4.2 billion EGP
- 50‑day moving average: 57,050 points (below current price, indicating short‑term momentum weakness)
- 200‑day moving average: 55,300 points (long‑term support remains intact)
EGX70 – Small‑ and Mid‑Cap Index

- Close: 2,145 points (+0.38%)
- Daily range: 2,120 – 2,170 points
- Volume: 3.8 billion EGP
- 50‑day moving average: 2,090 points (price above average, signalling upward momentum)
- 200‑day moving average: 1,950 points (strong support)
#### Technical Support and Resistance Levels
| Index | Immediate Support | Immediate Resistance | Medium Support | Medium Resistance |
|---|---|---|---|---|
| EGX30 | 56,300 | 57,200 | 55,800 | 57,800 |
| EGX70 | 2,100 | 2,180 | 2,050 | 2,250 |
---
Key Stock Analysis
Commercial International Bank (COMI)
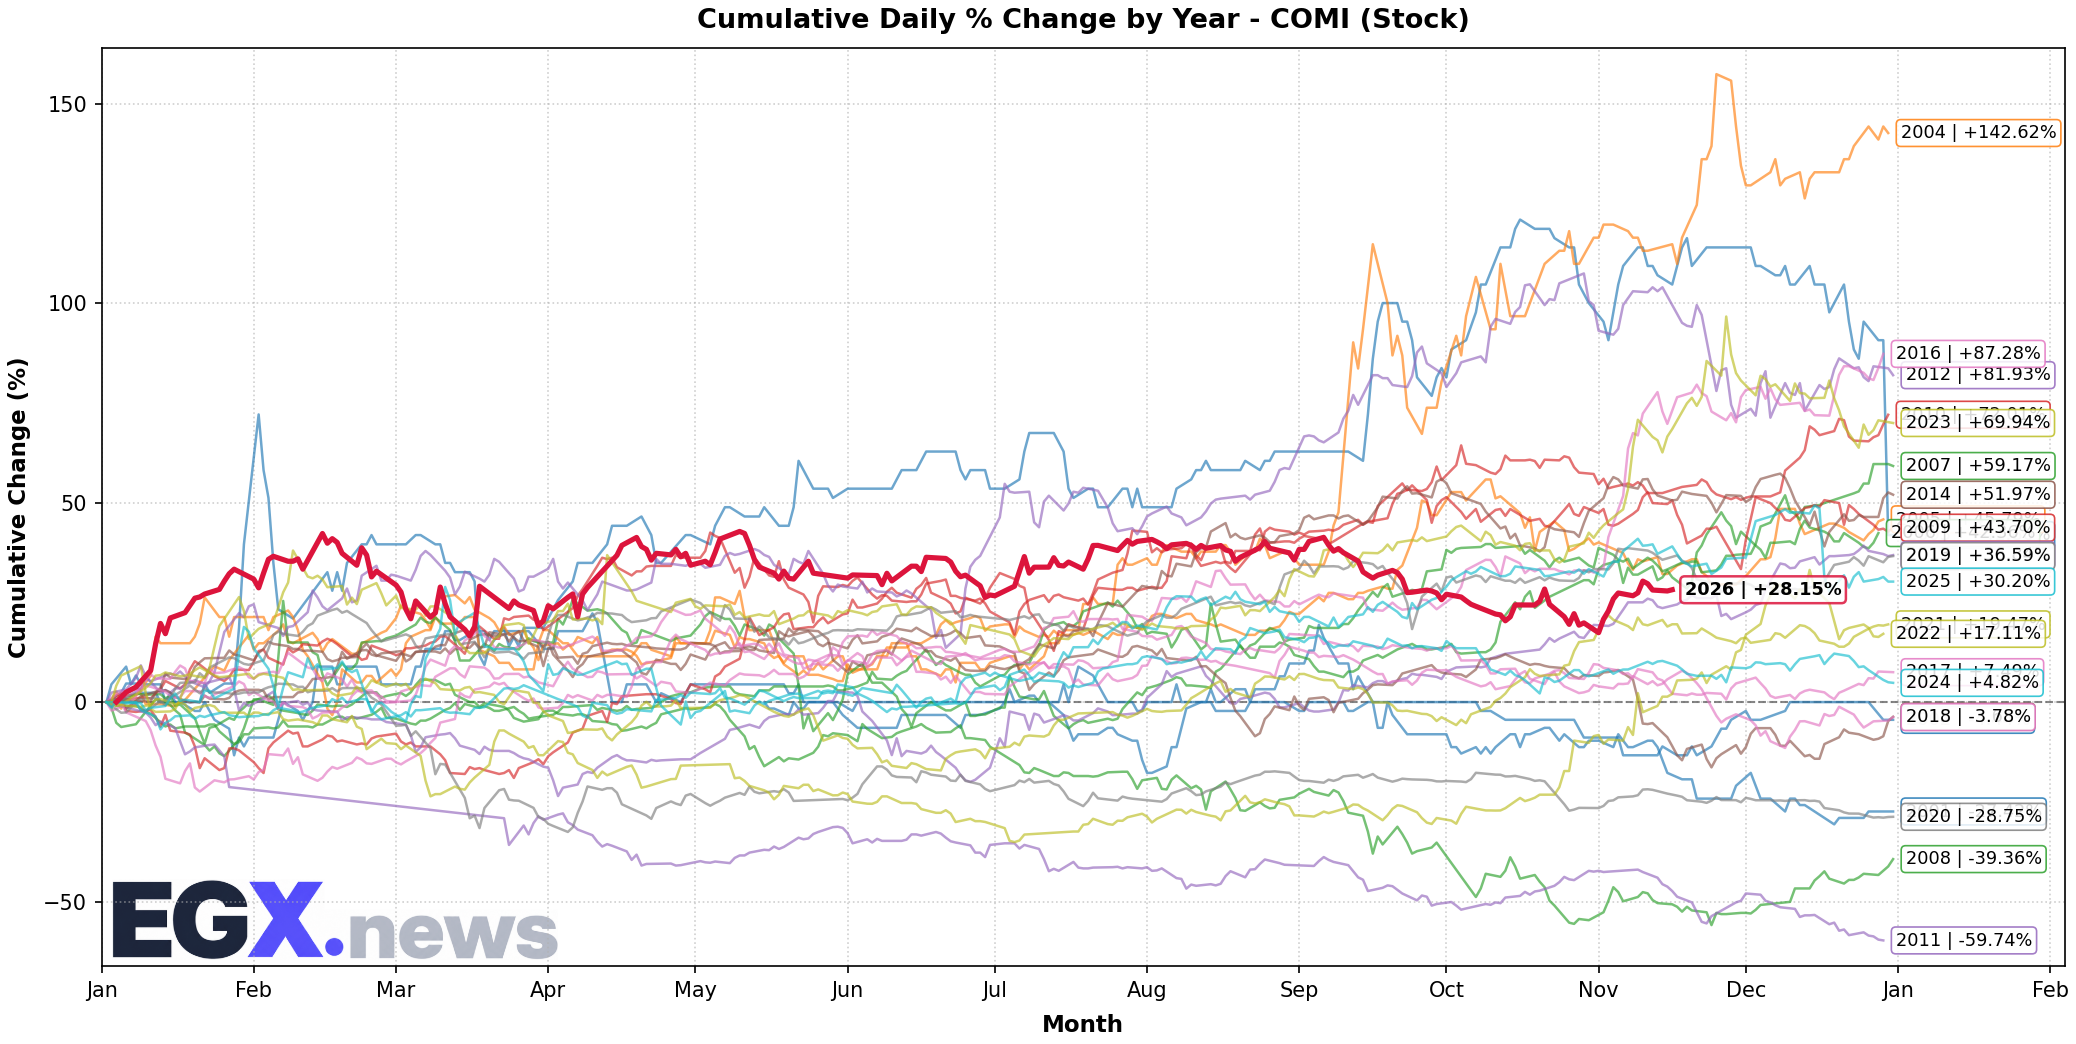
- Close: 78.40 EGP (−0.12%)
- Daily range: 77.80 – 79.00 EGP
- Volume: 210 million EGP
- Price‑to‑Earnings (P/E): 7.2×
- Dividend yield: 5.8 % (semi‑annual renewal)
- Current liquidity ratio: 1.45
- Quick ratio: 1.20
#### Technical Levels for COMI
| Level | Value (EGP) |
|---|---|
| Immediate support | 77.50 |
| Immediate resistance | 79.20 |
| Medium support | 75.80 |
| Medium resistance | 81.00 |
Analysis: The stock trades above its 50‑day moving average (77.90 EGP) and below its 200‑day moving average (78.60 EGP), suggesting a consolidation phase with a mild upward bias. Strong liquidity and an attractive dividend yield make COMI a relative haven for investors seeking steady income amid rising global interest rates.
---
Other Notable Stocks (per AI analysis)
| Stock | Sector | Positive Rationale | Close | Daily Change |
|---|---|---|---|---|
| QNBA | Banks | Strong deposit base, disciplined cost‑to‑income ratio | 5,420 | +0.45 % |
| FWRY | Digital Payments | New partnerships, healthy cash conversion cycle | 12.30 | +0.62 % |
| SWDY | Electricity & Cables | Beneficiary of the battery‑plant project (2 billion EGP) | 18.70 | +0.51 % |
| ABUK | Fertilizers | Robust domestic nitrogen demand, low leverage | 22.10 | +0.38 % |
#### Stocks with Negative Bias
| Stock | Sector | Negative Rationale | Close | Daily Change |
|---|---|---|---|---|
| TMGH | Real Estate Development | Higher financing costs, weak residential sales | 28.40 | −0.57 % |
| ORWE | Construction | Soft demand for cement and steel, declining RSI | 15.20 | −0.48 % |
| PHDC | Specialty Chemicals | Input‑cost pressures, bearish flag pattern | 9.80 | −0.73 % |
---
Sector Analysis
| Sector | Daily Performance | Key Notes |
|---|---|---|
| Banks & Financial Services | Mixed (−0.12 % for COMI, +0.45 % for QNBA) | Benefit from a higher‑rate environment, but pressure on mortgage lending remains notable. |
| Technology & Payments | Positive (+0.62 % for FWRY) | Investment flows into AI and digital infrastructure. |
| Industrials & Basic Materials | Positive (+0.51 % for SWDY, +0.38 % for ABUK) | Support from battery projects and agricultural expansion with India. |
| Real Estate & Construction | Negative (−0.57 % for TMGH, −0.48 % for ORWE) | Sensitive to financing‑cost rises and weak domestic demand. |
| Specialty Chemicals | Negative (−0.73 % for PHDC) | Margins squeezed by rising raw‑material costs. |
---
Liquidity and Financial Ratios
- Daily traded value to market cap (EGX30): 0.84 %
- Daily traded value to market cap (EGX70): 1.12 %
- Value of traded mid‑ and small‑cap stocks: 58 % of total volume.
- Interest coverage ratio (banking sector, average): 3.2× (comfortable level).
---
Summary and Outlook
1. Liquidity remains solid, with a clear tilt toward mid‑ and small‑cap stocks that gain from industrial stimulus policies and renewable‑energy initiatives.
2. Global pressures—especially the prospect of a U.S. rate hike and oil‑price volatility—continue to create a cautious risk environment, explaining the modest EGX30 performance.
3. Preferred opportunities lie in stocks offering:
- Recurring‑revenue models (digital payments, financial services).
- Direct exposure to infrastructure projects (batteries, renewables).
- Strong balance sheets with low leverage and attractive dividend yields.
4. Risks are concentrated in highly leveraged real‑estate and construction sectors, which could suffer if global financing costs keep rising.
Looking medium‑term, if global indices maintain a balance between monetary‑policy tightening and growth‑supporting industrial investment, EGX70 may continue to outperform EGX30, with a potential break above the 2,180‑point resistance in upcoming sessions should positive data on battery projects and India partnerships be confirmed.
Live Egyptian Equities Coverage
Track real-time quotes, order book market depth, and quantitative technical analytics for all 299 listed companies.
Open Real-Time Market Terminal →