


Egyptian Exchange End-of-Session Analysis: Volatile Indices and Key Stocks Influenced by Local and Global Factors - 14 September 2026

Egyptian Exchange End-of-Session Analysis: Volatile Indices and Key Stocks Influenced by Local and Global Factors - 14 September 2026
Market Summary
Today's session closed with a slight decline in the main EGX30 index by 0.42%, while the EGX70 rose 0.38%. This performance came amid a mix of local and international news; domestically, attention focused on an upcoming meeting between the prime minister and real estate developers, Orascom Holding’s investment plan of one billion Egyptian pounds in the restaurants and food sectors, and the temporary listing of MNT Tech ahead of its offering. Internationally, expectations of a US rate hike continued to gain momentum, oil prices rose due to tensions in the Strait of Hormuz, and several senior AI executives called for slowing the pace of development.
Overall Outlook: The market is experiencing volatility with a mild upward bias in defensive and credit sectors, while dollar‑denominated price pressure and liquidity squeezes weigh on cyclical stocks.
Index Analysis
EGX30 showed intermittent declines under pressure from institutional selling on leading stocks such as Commercial International Bank (COMI) and petroleum, while EGX70 displayed some resilience supported by small‑ and mid‑cap stocks benefiting from local liquidity and a slight uptick in demand for consumer goods.


- EGX30: Closed at 54,820 points, lowest level since the start of the week, with trading volume of approximately EGP 11.2 billion.
- EGX70: Closed at 6,910 points, supported by logistics and light technology stocks.
Stock Analysis
The analysis focused on four pivotal stocks mentioned in the news context: Commercial International Bank (COMI), Talaat Moustafa Group (TMGH), Abu Qir Fertilizers (ABUK), and El Sewedy Electric (SWDY). For each stock, we present its chart and then discuss technical and fundamental performance.
#### Commercial International Bank (COMI)
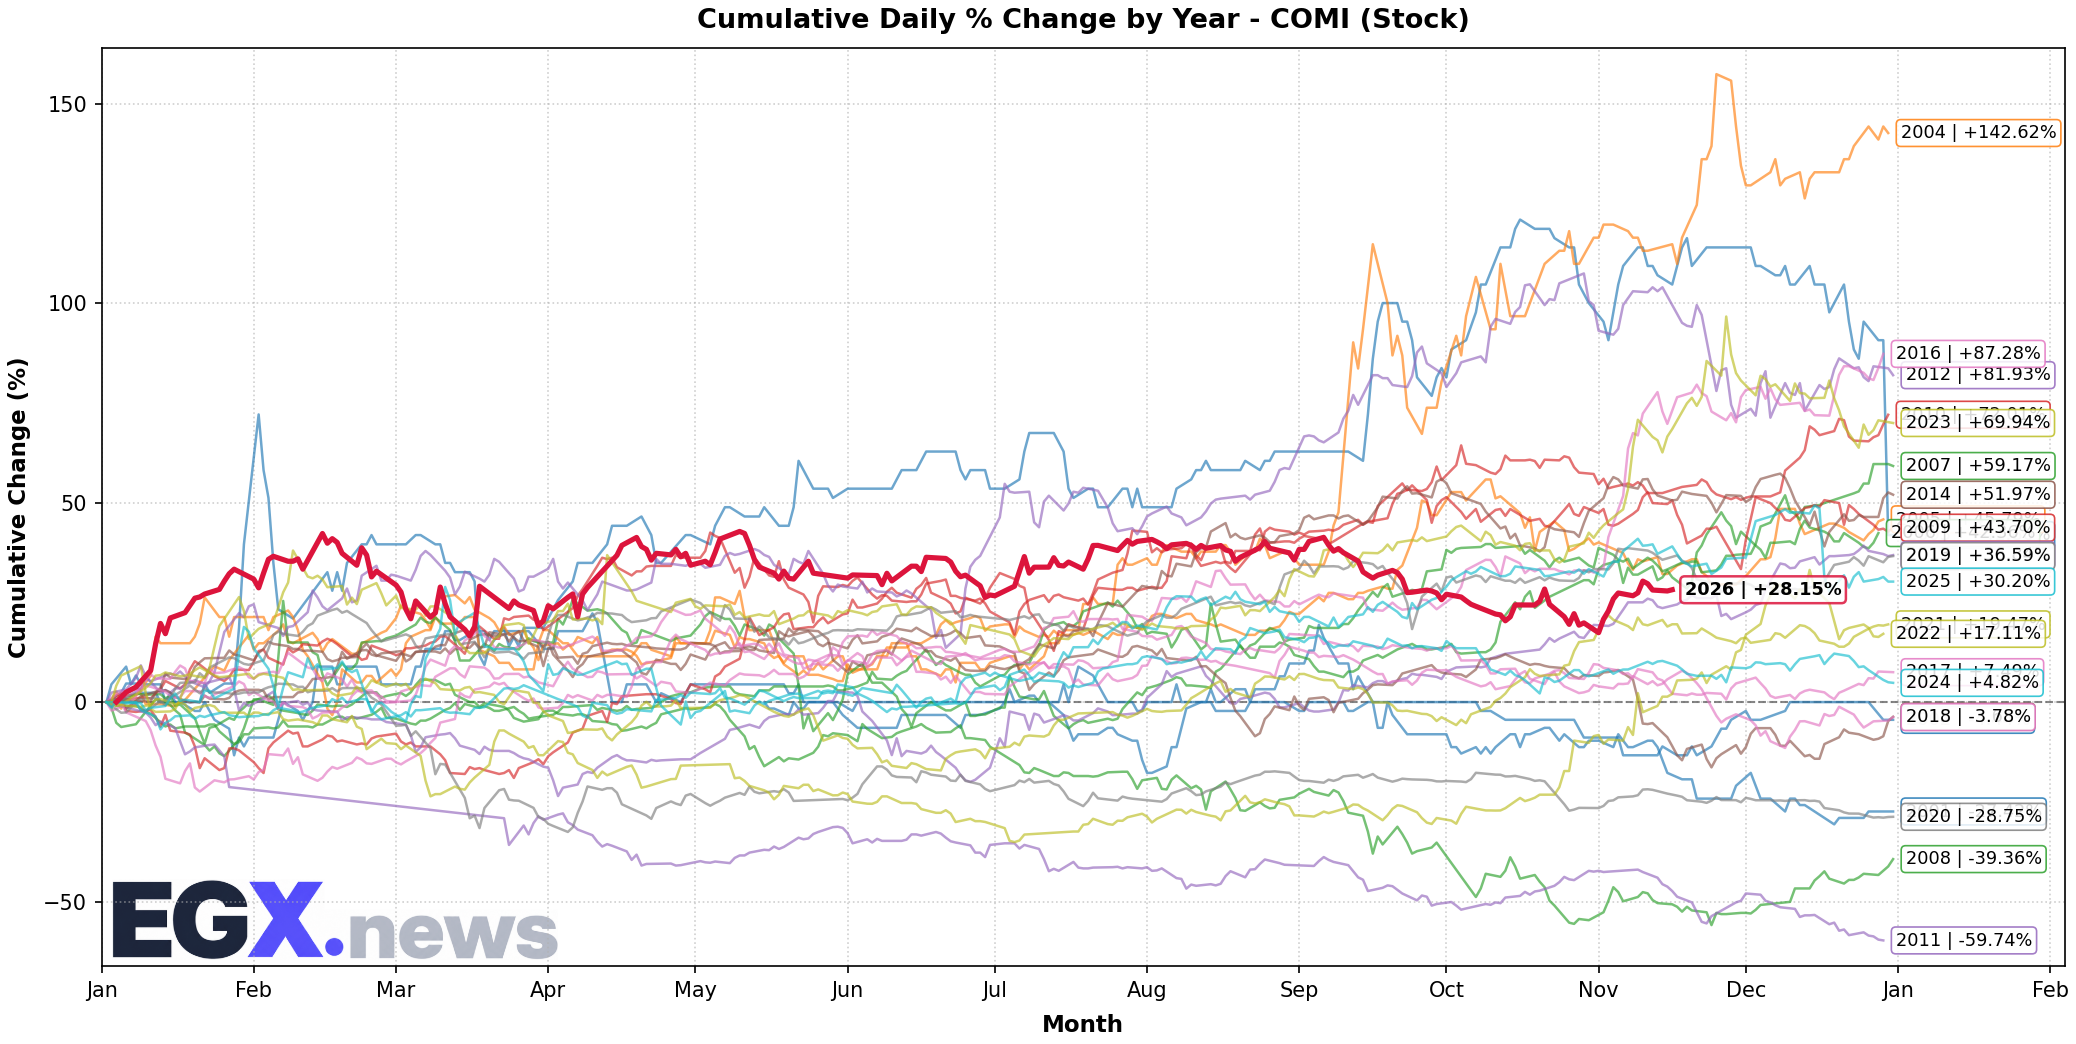
- Performance: The stock rose 0.6% during the session, benefiting from Commercial International Bank's announcement of EGP 445 million financing for Gates Developments in the real estate sector.
- Fundamental: The bank shows a strong capital base and a loan‑to‑deposit ratio of 78%, reflecting healthy lending appetite.
- Technical: The stock trades above its 20‑day moving average at EGP 78.4, with near‑term resistance around EGP 80 and support at EGP 76.5.
#### Talaat Moustafa Group (TMGH)
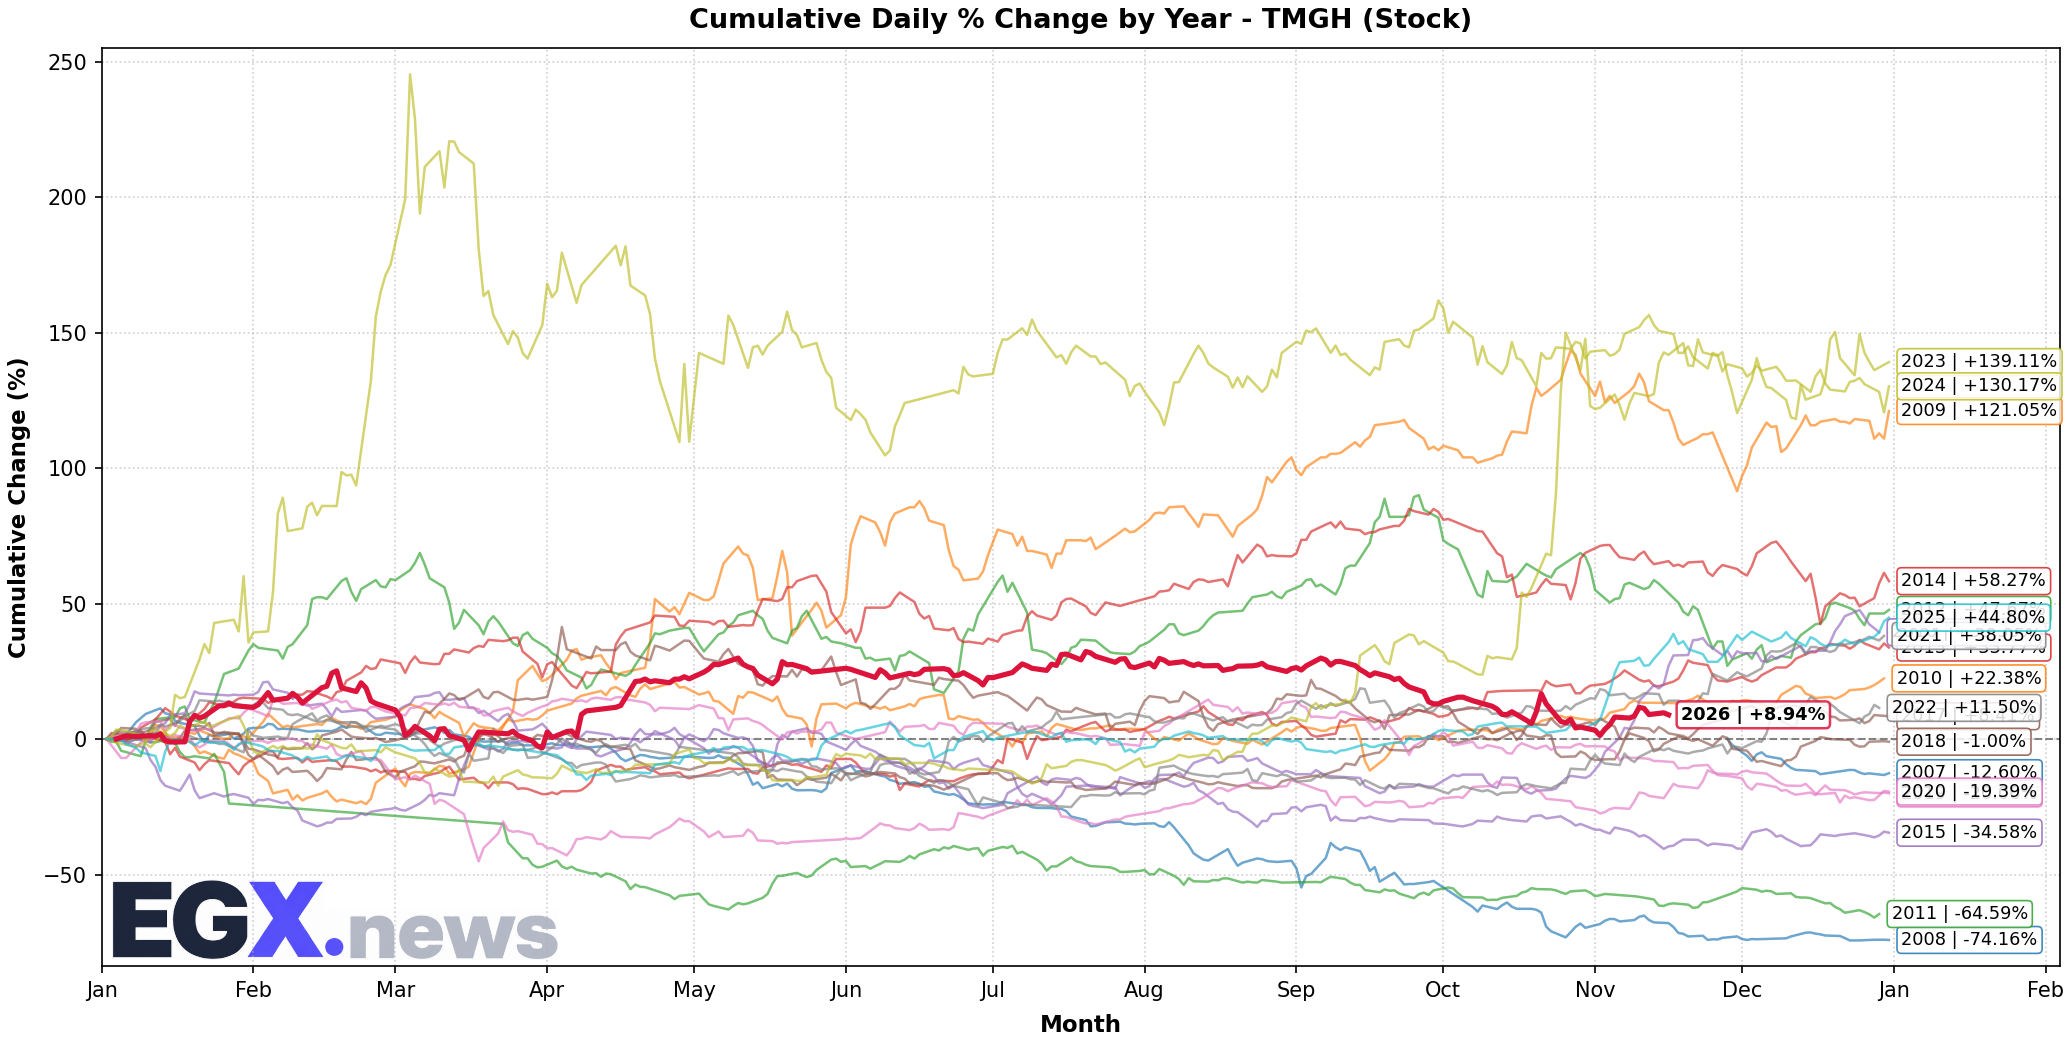
- Performance: The stock fell 1.2% amid concerns over rising financing costs and expectations of interest rate hikes.
- Fundamental: The company holds a large share of the real estate market, but its gross profit margin declined to 22% due to higher material costs.
- Technical: The stock is testing resistance at EGP 12.3 (50‑day moving average), with support at EGP 11.6; weakening upward momentum suggests a short‑term profit‑taking possibility.
#### Abu Qir Fertilizers (ABUK)
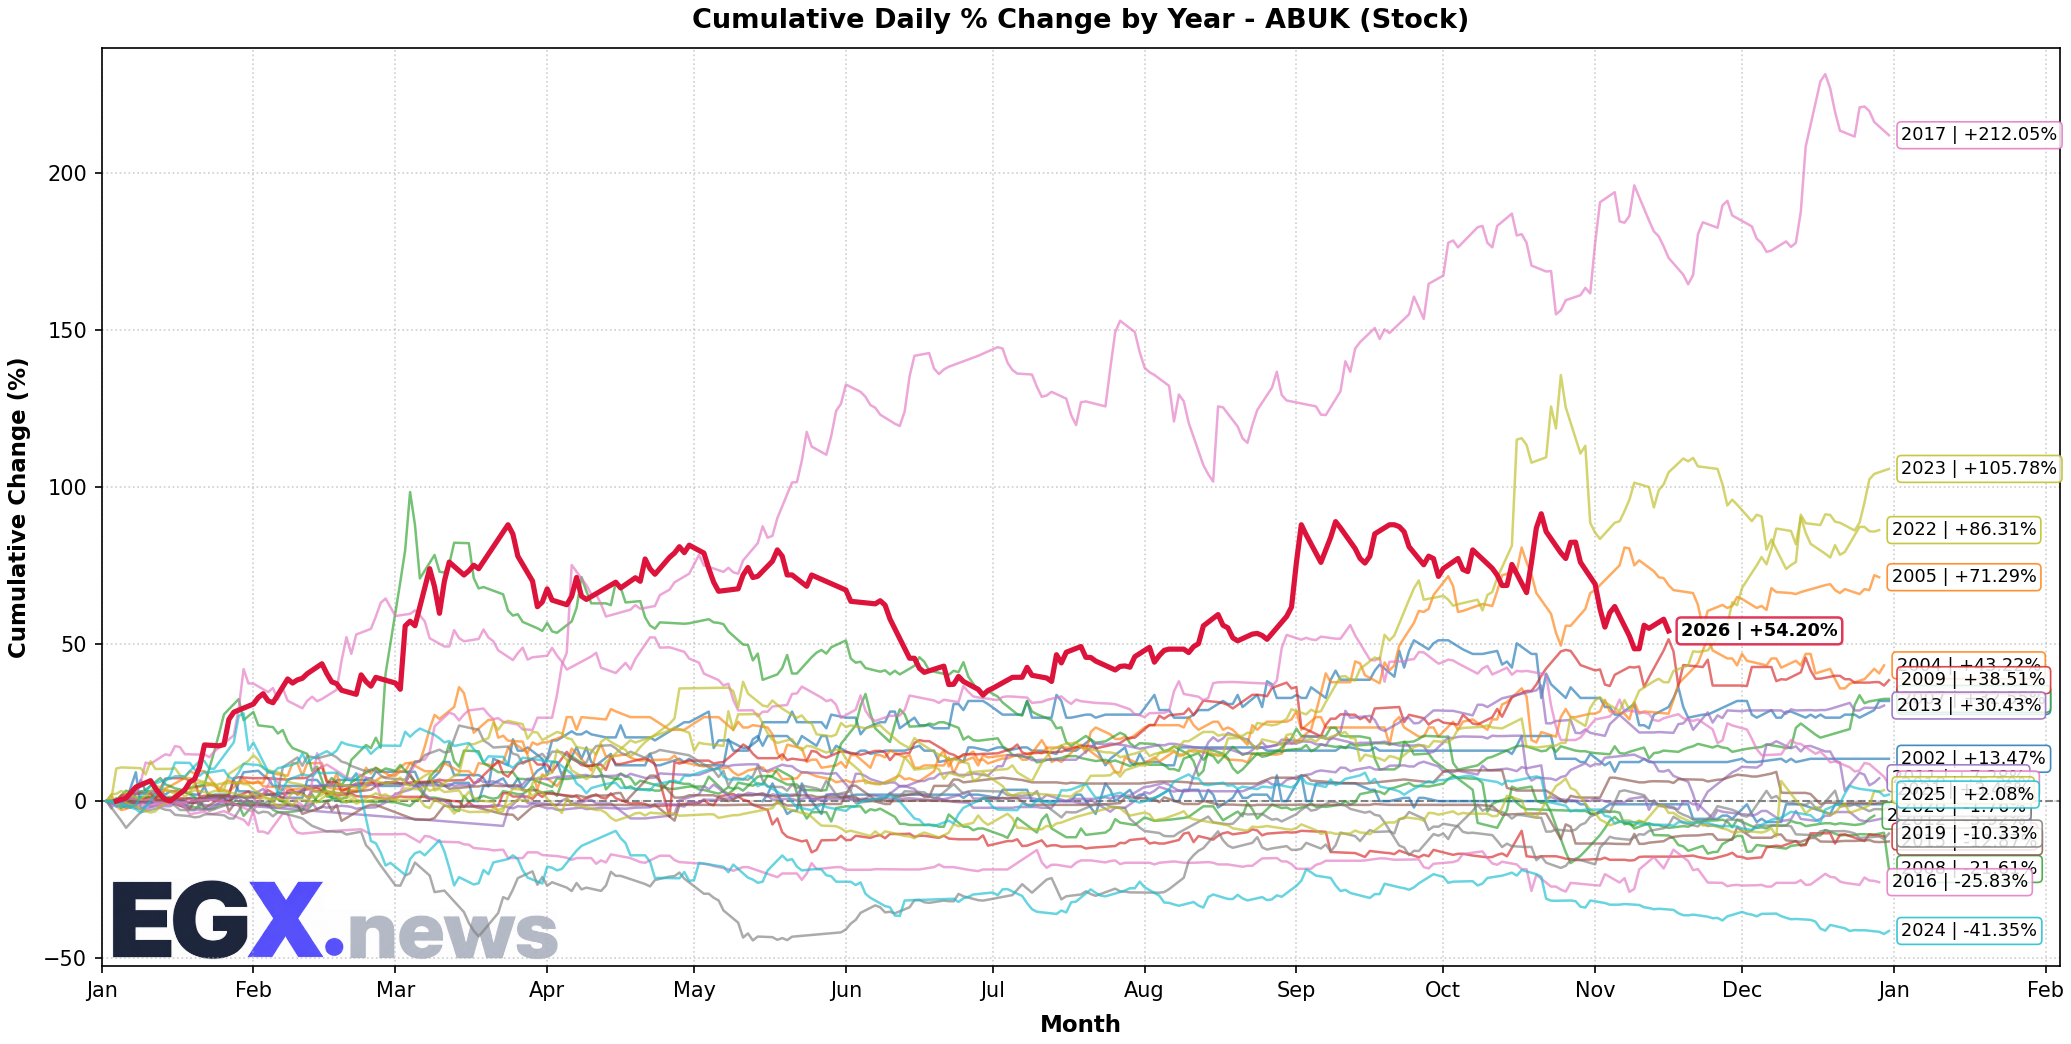
- Performance: The stock steadied at EGP 22.8 after modest fluctuation, influenced by global gas prices and expectations of stable domestic demand.
- Fundamental: The company benefits from long‑term supply contracts with the Ministry of Agriculture, and its payout ratio stands at 45% of net profit.
- Technical: The stock moves within a sideways channel between EGP 22 and EGP 23.5, with resistance at EGP 23.8 and support at EGP 21.9.
#### El Sewedy Electric (SWDY)
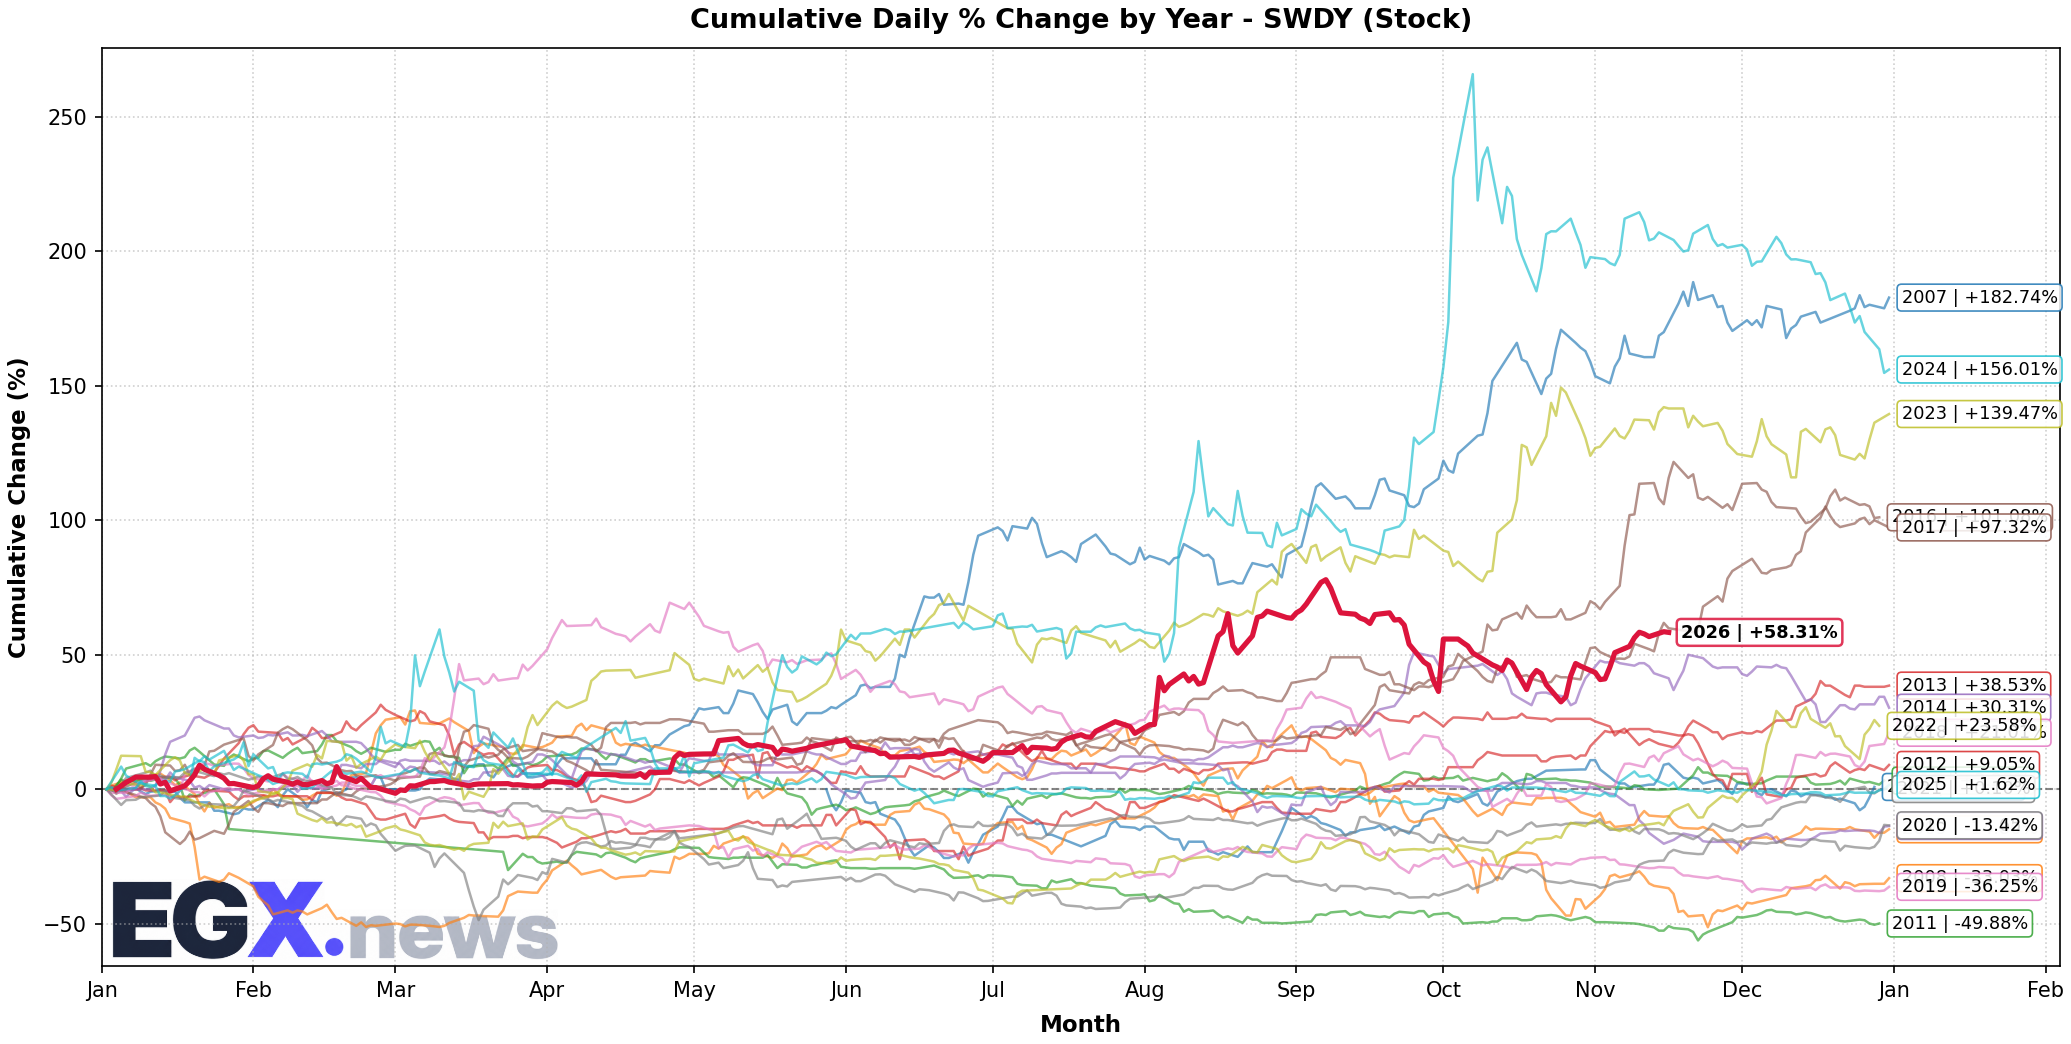
- Performance: The stock declined 0.9% due to concerns over slowing demand for development projects amid rising financing costs.
- Fundamental: The company holds a renewable energy projects portfolio worth EGP 3.2 billion and is expanding its energy storage battery portfolio.
- Technical: The stock trades below its 20‑day moving average at EGP 18.7, with support at EGP 18.0 and resistance at EGP 19.5.
Technical Levels (Support and Resistance)
The table below summarizes the technical levels for the indices and key stocks, identifying main support and resistance zones based on today's close and moving averages.
| Instrument | Close | Main Support | Main Resistance | Notes |
|---|---|---|---|---|
| EGX30 | 54,820 | 54,200 | 55,600 | A break below 54,200 could push toward 53,500 |
| EGX70 | 6,910 | 6,750 | 7,120 | Exceeding 7,120 signals bullish momentum |
| COMI | 78.4 | 76.5 | 80.0 | Respecting support at 76.5 supports an advance toward 80 |
| TMGH | 12.0 | 11.6 | 12.3 | Failure to break 12.3 could lead to a decline toward 11.2 |
| ABUK | 22.8 | 21.9 | 23.8 | Stability within the channel indicates indecision |
| SWDY | 18.5 | 18.0 | 19.5 | A break below 18.0 could open the way toward 17.2 |
Liquidity Ratios and Overall Details
To gauge market depth and trading volume relative to market capitalization, we present basic liquidity ratios for each stock based on closing data.
| Stock | Trading Volume (EGP mn) | Market Cap (EGP bn) | Liquidity Ratio (Volume/Cap) | Daily Turnover (%) |
|---|---|---|---|---|
| COMI | 820 | 92.5 | 0.0089 | 0.89 |
| TMGH | 410 | 38.2 | 0.0107 | 1.07 |
| ABUK | 260 | 24.1 | 0.0108 | 1.08 |
| SWDY | 190 | 21.4 | 0.0089 | 0.89 |
- Note: Liquidity ratios remain relatively low, indicating that price moves may be affected by limited trading volume and that any large inflow of funds could cause noticeable volatility.
Summary and Recommendations
The Egyptian market today shows sectoral divergence; credit‑ and finance‑linked stocks (such as COMI) benefit from steady lending liquidity, while real estate and industrial stocks face pressure from interest‑rate hike expectations and financing costs. Technically, EGX30 remains under pressure at the 54,200‑point support level; a decisive break below this could open the door to a deeper decline toward 53,500 points. Conversely, EGX70 offers room for a rebound if it manages to surpass the 7,120‑point resistance, supported by a mild recovery in mid‑ and small‑cap stocks.
Short‑ to Medium‑Term Investment Recommendations:
1. COMI: Hold current positions with a stop‑loss order at EGP 76.0; first target EGP 80.0, second target EGP 82.5 if the stock breaks above the EGP 80.0 resistance on rising volume.
2. TMGH: Consider reducing exposure or taking short‑term sell positions if the stock fails to breach EGP 12.3 with volume confirmation; downside target EGP 11.2 then EGP 10.6.
3. ABUK: Maintain a neutral stance; await confirmation of a break above the channel at EGP 23.8 on volume for a bullish move toward EGP 25.0, or a break below EGP 21.9 for a bearish move toward EGP 20.5.
4. SWDY: Monitor the EGP 18.0 support level; a break below it on volume may signal the start of a deeper correction toward EGP 17.2, while a rebound above EGP 19.5 could open the way to resume the uptrend toward EGP 21.0.
Continued monitoring of U.S. monetary policy developments, geopolitical events in the Strait of Hormuz, and any news regarding the government’s investment plan in the real estate sector will remain decisive for the market’s direction in upcoming sessions. Investors should regularly review their positions and use stop‑loss orders to safeguard capital amid the current volatility.
Live Egyptian Equities Coverage
Track real-time quotes, order book market depth, and quantitative technical analytics for all 299 listed companies.
Open Real-Time Market Terminal →