


Egyptian Exchange Session Harvest: Analysis of EGX30 & EGX70 Indices and Performance of Leading Stocks - 25 September 2026

Egyptian Exchange Session Harvest: Analysis of EGX30 & EGX70 Indices and Performance of Leading Stocks - 25 September 2026
Session Summary
The Egyptian Exchange closed with a collective decline in the main indices, as the EGX30 fell 0.83% to around 54,200 points, while the EGX70 dropped 1.92% to near 2,080 points. Selling pressure came from the financial sector and some leading stocks, while liquidity injected by the central bank in today’s treasury bill auction (EGP 82.3 billion) provided partial temporary stability.
Trading volume reached EGP 1.2 billion, with heavy concentration in Commercial International Bank (COMI) stock, which accounted for about 10.9% of total liquidity. The market absorbed part of the external pressure stemming from rising U.S. Treasury yields and Strait of Hormuz tensions, but it remains sensitive to any shift in U.S. monetary policy.
"Today's liquidity injected by the central bank helped ease the sharp selling pressure, but the lack of strong local catalysts leaves the market vulnerable to minor fluctuations driven by global news."
— Market Money Analyst, Cairo Investment Portfolio
Index Analysis
EGX30 (Main Index)

The main index showed a clear downward trend during the session, testing near‑support around 53,500 points before stabilizing at close near 54,200 points. The session’s Relative Strength Index (RSI) stood at 38, indicating approaching oversold territory but not reaching those levels.
EGX70 (Small‑ and Mid‑Cap Index)

EGX70 exhibited greater volatility, falling to a low of 2,040 points before recovering to 2,080 points at session close. The MACD momentum indicator recorded a negative crossover, reinforcing a short‑term bearish outlook, while the 50‑day moving average remains above the 2,100‑point level, which could provide technical support on a bounce.
Key Stocks Analysis
Commercial International Bank (COMI)
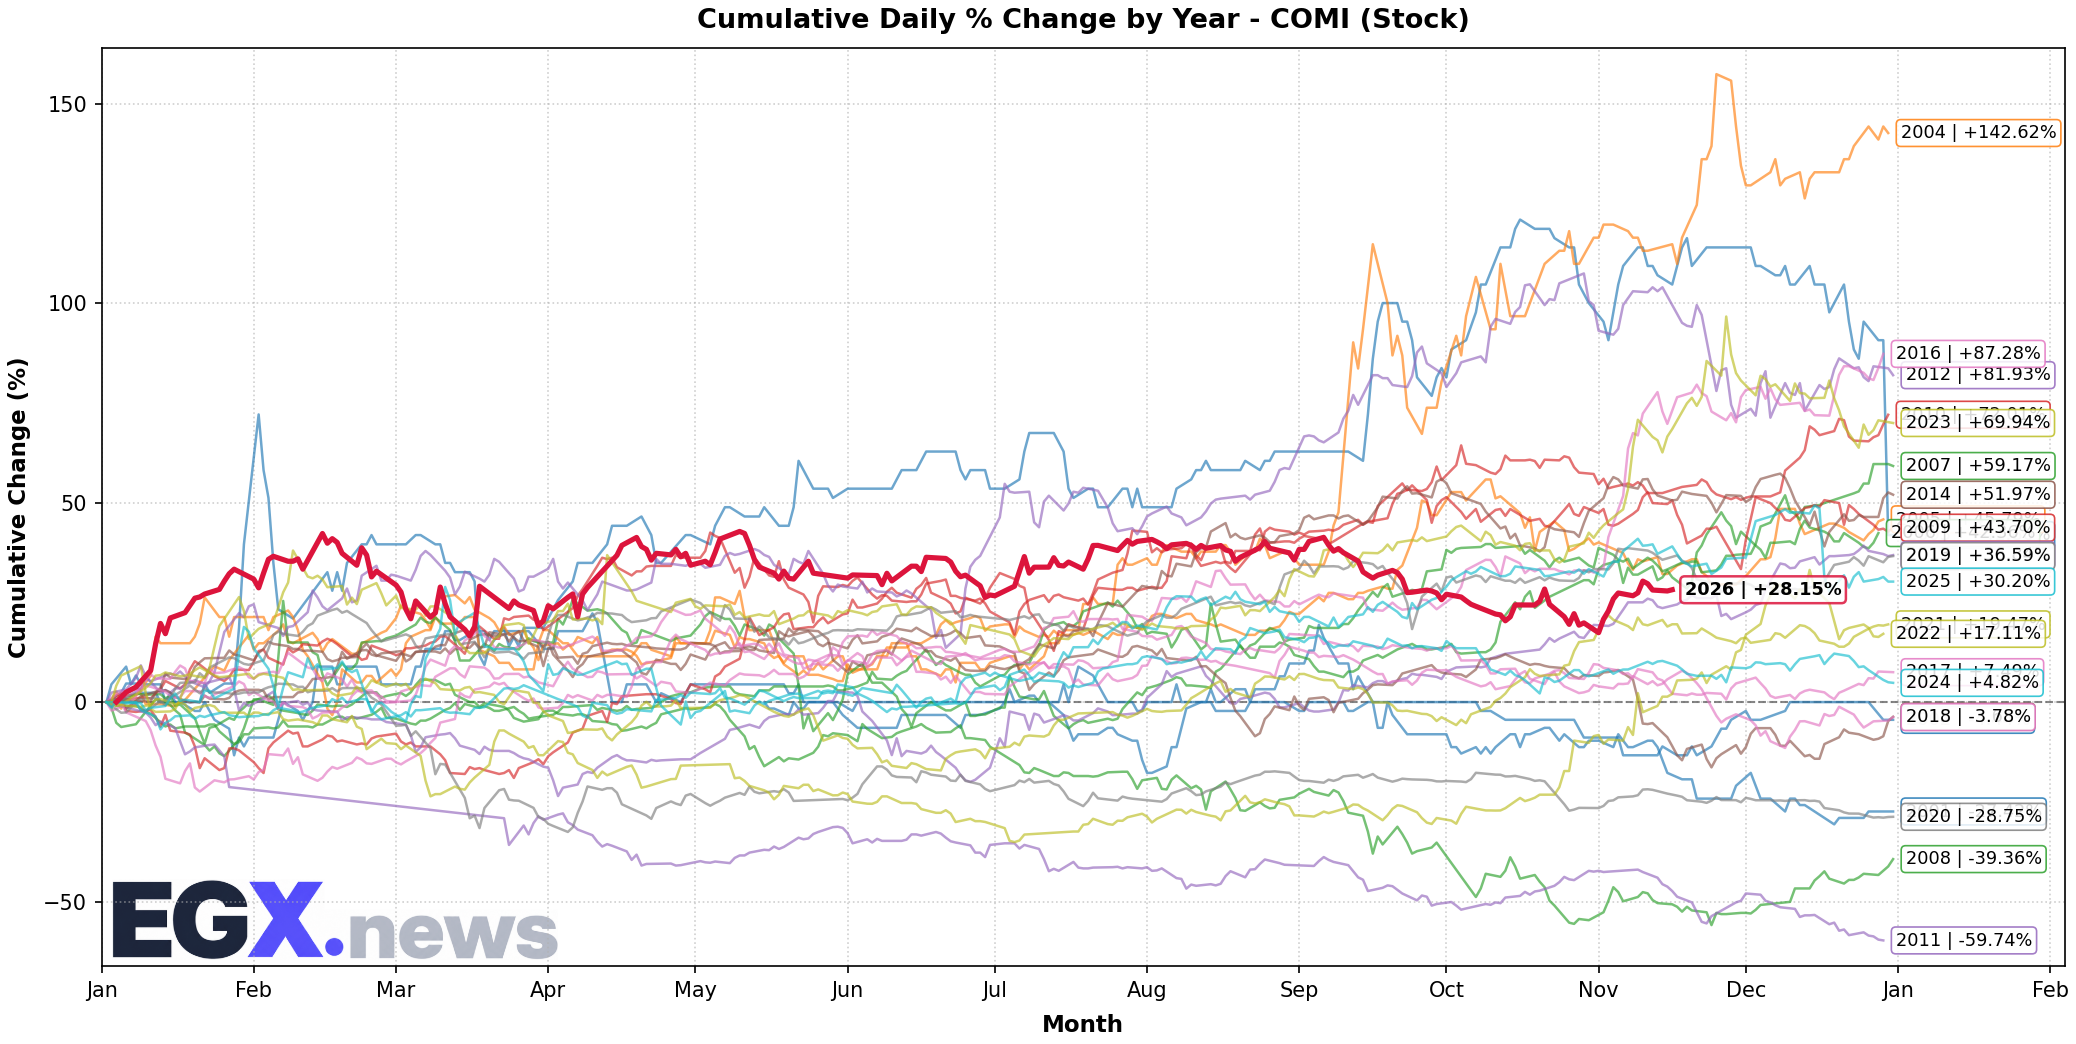
The stock closed at EGP 68.40 after a slight decline of 0.45% during the session. Trading volume was large at EGP 130 million, driven by institutional and Arab investors. Technically, the stock is moving within a narrow upward channel with immediate support at EGP 67.00 and resistance at EGP 70.00. The bank's current liquidity ratio () is estimated at 1.22, while the quick liquidity ratio () equals 0.88, reflecting a relatively comfortable liquidity position for the banking sector.
Talaat Mustafa Group (TMGH)
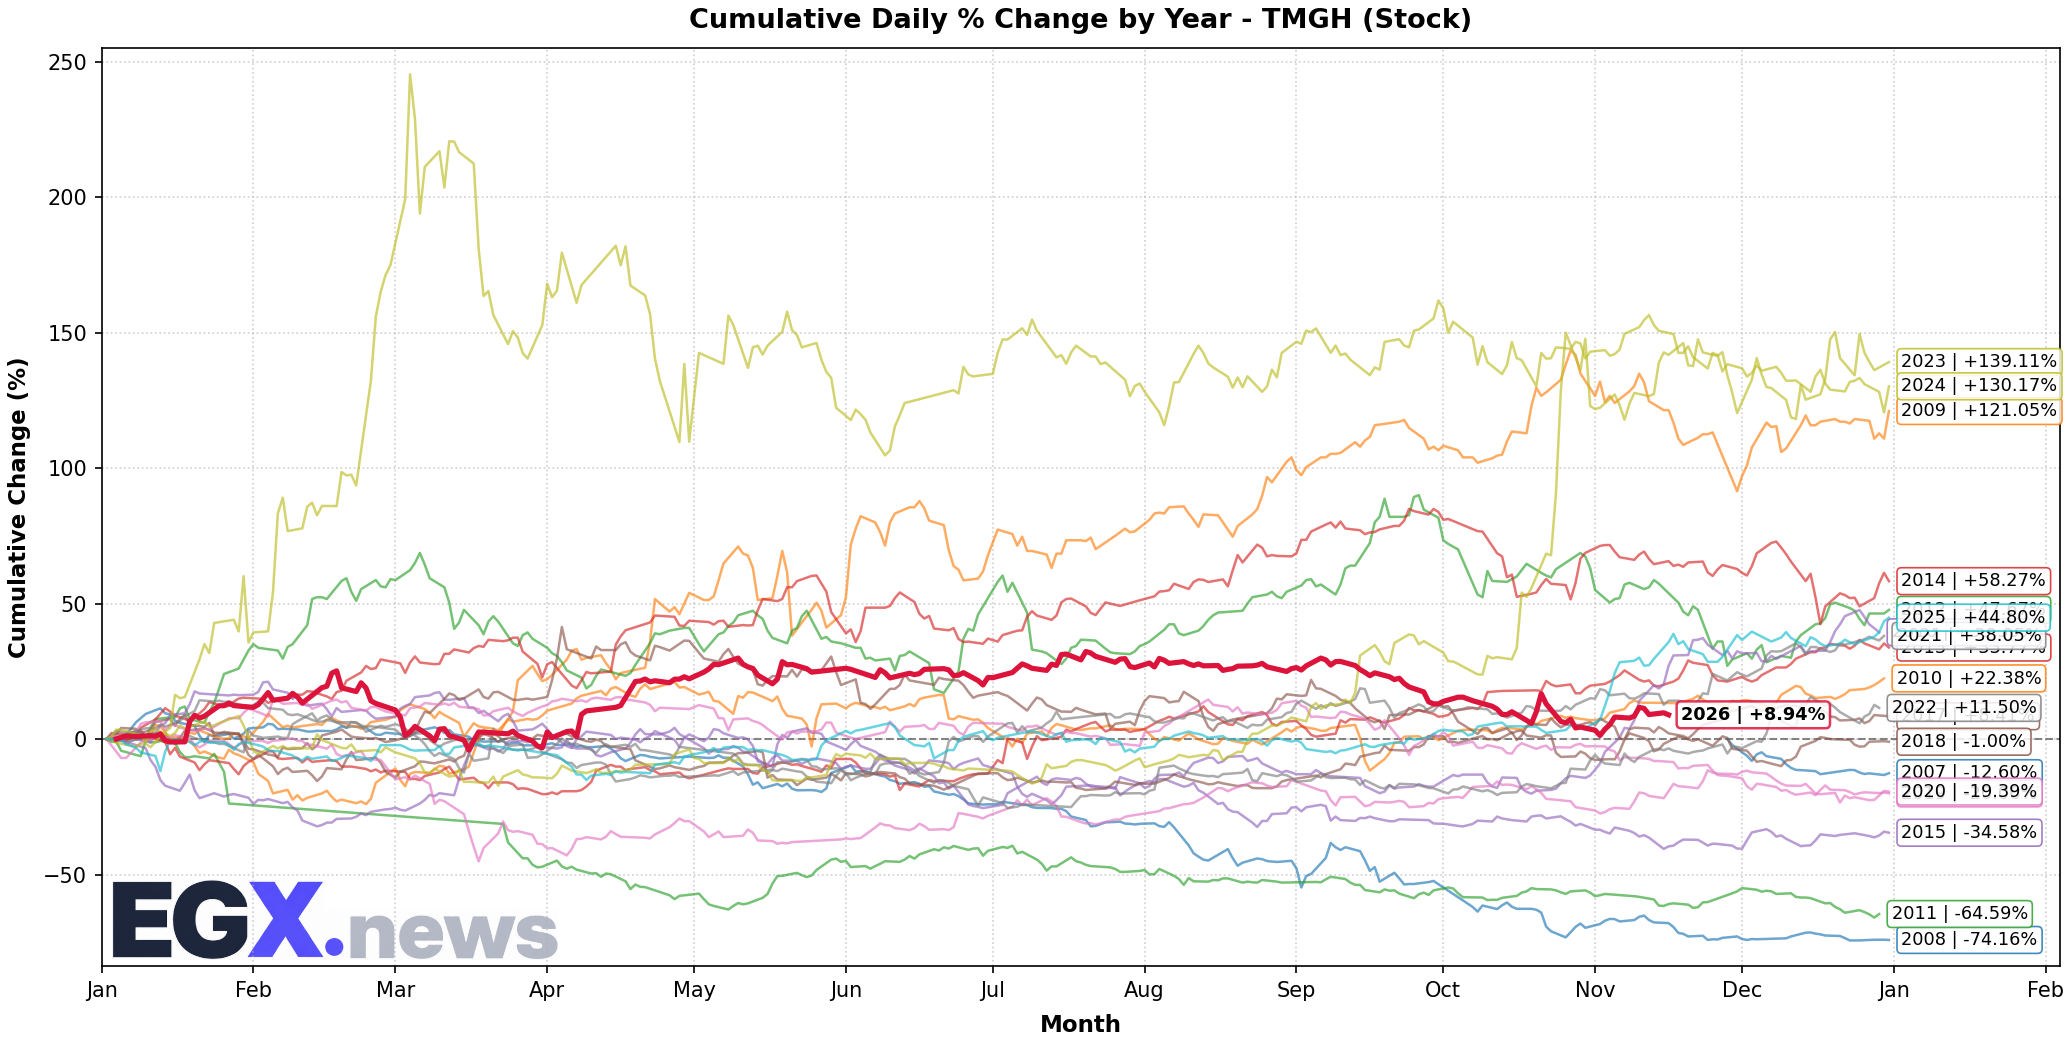
The stock fell to EGP 22.10, a decline of 1.78%, affected by concerns over demand for luxury residential units amid weakening tourism and financing flows. Technical support stands at EGP 21.50, with nearby resistance at EGP 23.00. The debt‑to‑equity ratio (‑‑) is 0.62, and the interest coverage ratio () reaches 4.3×, indicating an ability to service debt despite the challenging environment.
Abu Qir Fertilizers (ABUK)
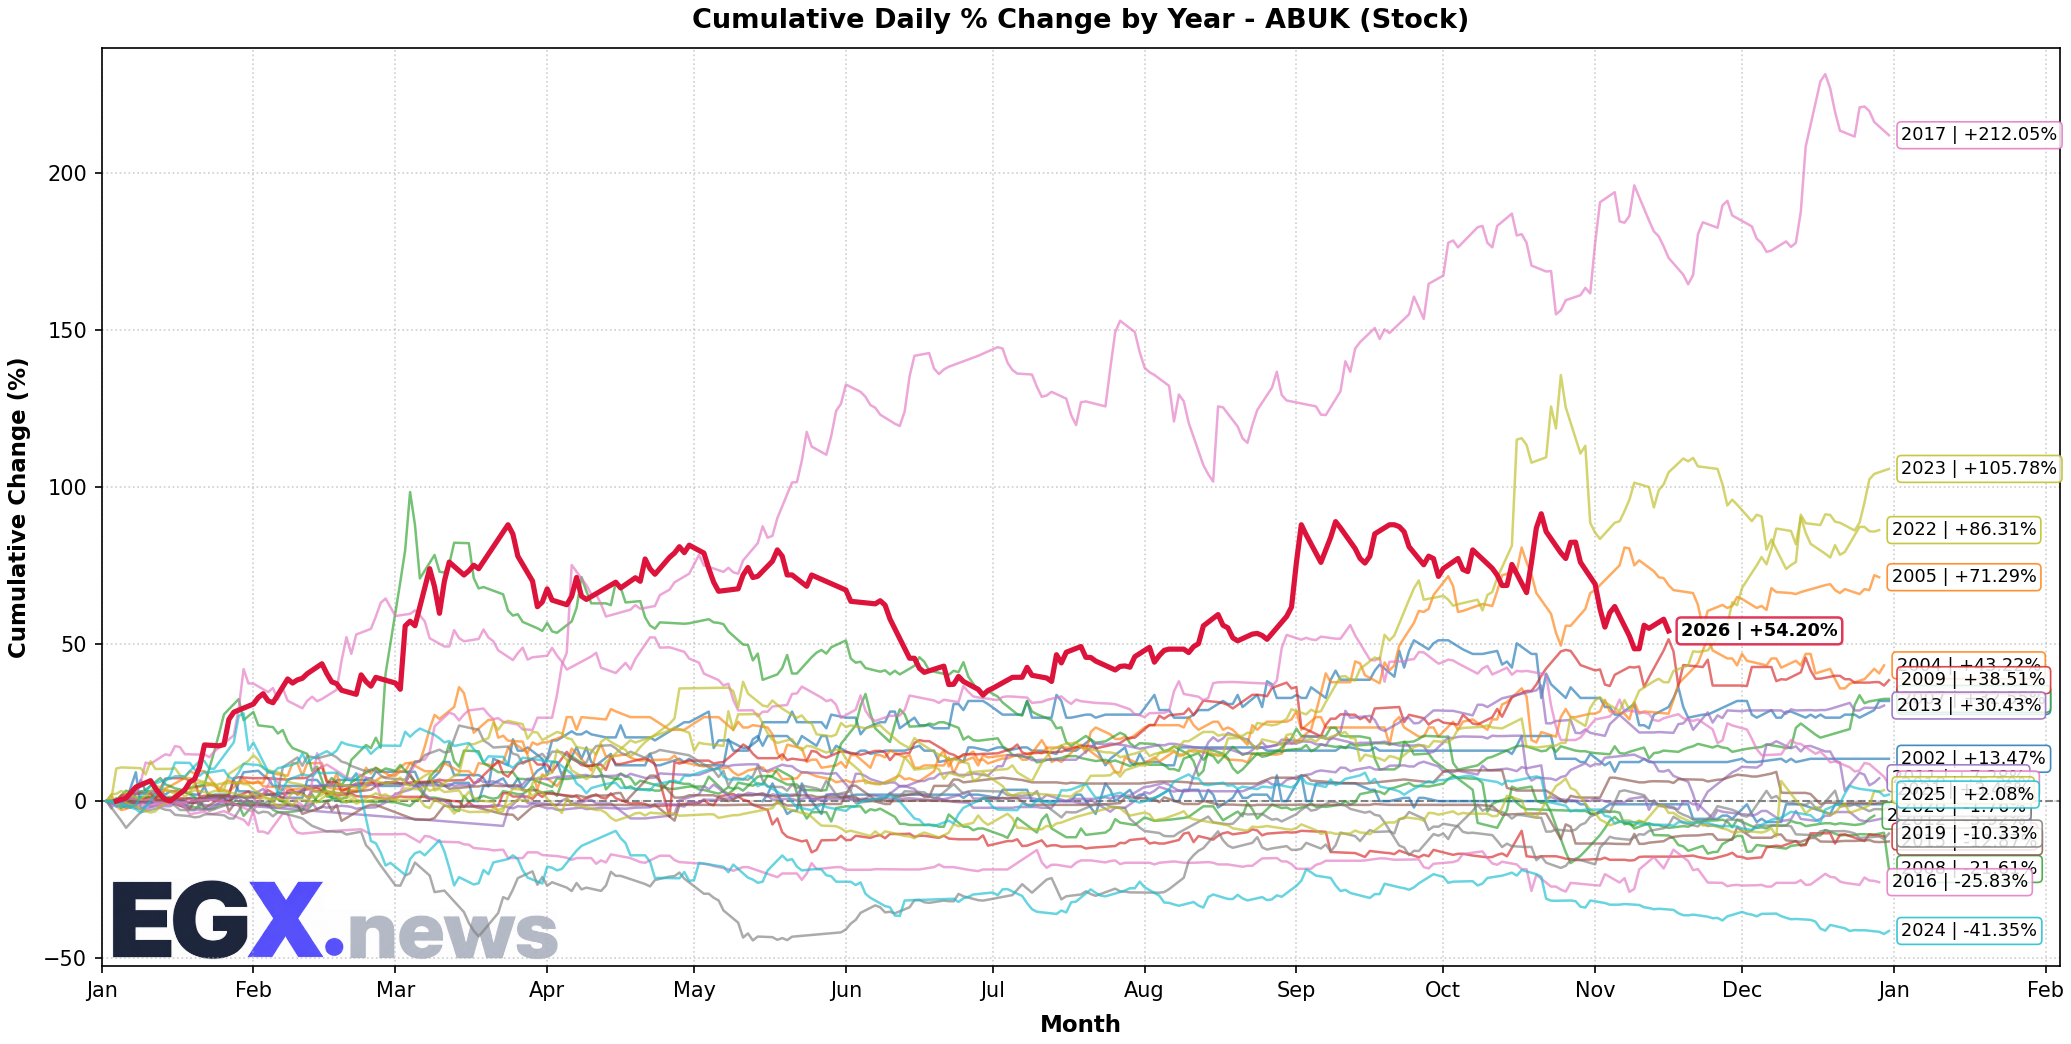
The stock steadied at EGP 45.60 after a modest decline of 0.62%, with trading volume of EGP 85 million. The stock shows technical support at EGP 44.80 and resistance at EGP 47.00. Return on equity (ROE) is estimated at 11.4%, while the free cash flow to debt ratio () stands at 0.18, reflecting a moderate capacity to generate liquidity after meeting obligations.
El‑Sewedy Electric (SWDY)
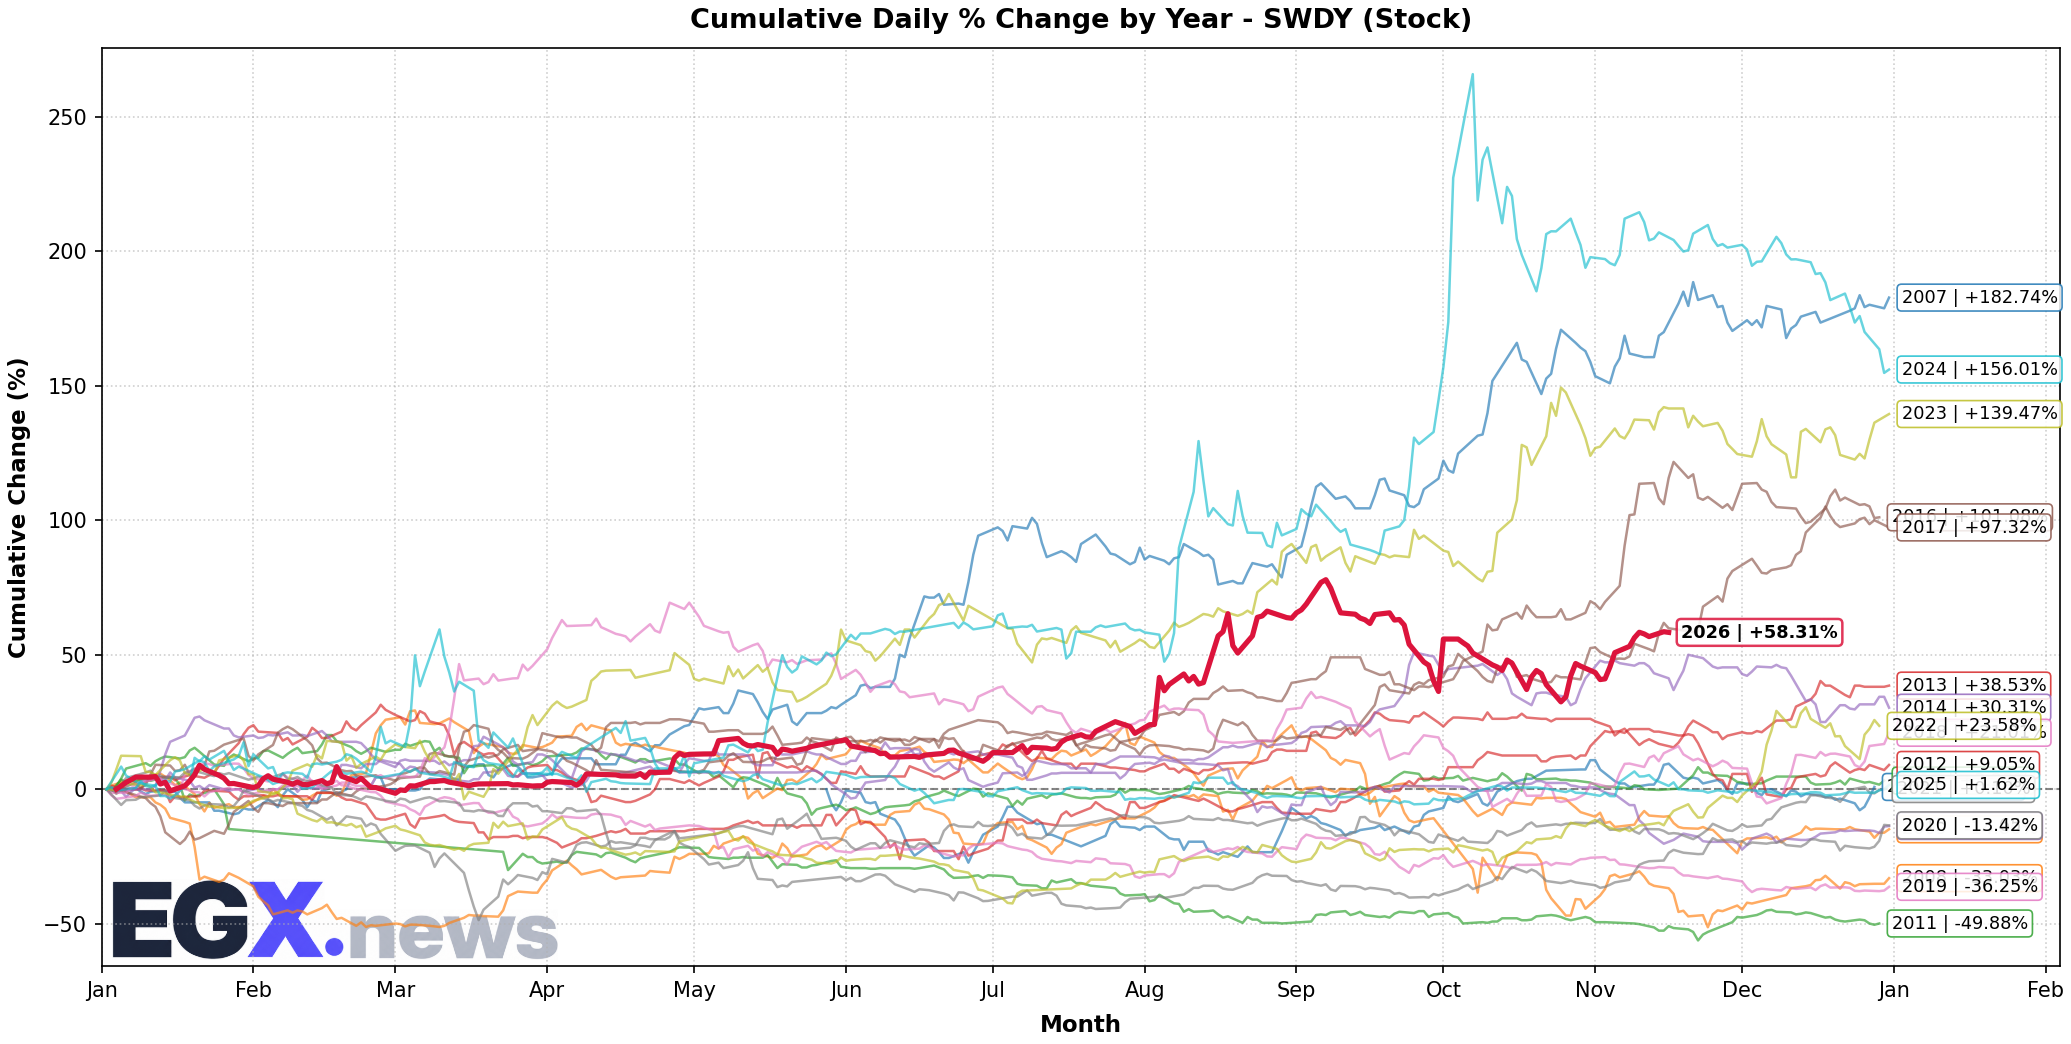
The stock declined to EGP 18.90, a drop of 1.32%, impacted by global fuel price pressures and energy demand outlook. Nearest support is at EGP 18.40, while resistance lies at EGP 19.80. The net‑debt‑to‑EBITDA ratio is 2.9×, and the interest coverage ratio () is approximately 3.1×, indicating moderate tolerance for liquidity risk in a high‑interest‑rate environment.
Technical Levels and Support/Resistance
| Instrument | Immediate Support (EGP/Point) | Immediate Resistance (EGP/Point) | Secondary Support | Secondary Resistance |
|---|---|---|---|---|
| EGX30 | 53,500 نقطة | 55,000 نقطة | 52,800 نقطة | 56,200 نقطة |
| EGX70 | 2,040 نقطة | 2,200 نقطة | 1,970 نقطة | 2,300 نقطة |
| COMI | 67.00 جنيه | 70.00 جنيه | 65.50 جنيه | 71.50 جنيه |
| TMGH | 21.50 جنيه | 23.00 جنيه | 20.80 جنيه | 23.80 جنيه |
| ABUK | 44.80 جنيه | 47.00 جنيه | 43.50 جنيه | 48.20 جنيه |
| SWDY | 18.40 جنيه | 19.80 جنيه | 17.80 جنيه | 20.50 جنيه |
Liquidity Ratios and Money Flows
| Stock | Current Liquidity Ratio () | Quick Liquidity Ratio () | Cash to Short‑Term Obligations Ratio () | Net Foreign & Arab Buy Today (EGP millions) |
|---|---|---|---|---|
| COMI | 1.22 | 0.88 | 0.31 | +12.4 |
| TMGH | 0.94 | 0.61 | 0.18 | –6.7 |
| ABUK | 1.08 | 0.73 | 0.24 | +3.1 |
| SWDY | 0.87 | 0.55 | 0.12 | –4.9 |
This shows that the banking sector (COMI) retains the best liquidity indicators among the four stocks, while real‑estate and electricity firms display short‑term liquidity pressure, in line with the overall decline in the EGX70.
Macro Outlook and Risks
"U.S. Treasury yields above 5.44% for the 30‑year term and sustained pressure on oil prices create an unfavorable environment for emerging equities, but stable local interest rates and Africa‑focused investment directives could offer some protection for leading stocks."
— African Development Bank Investment Alliance Report
Global data indicate that U.S. interest‑rate risks will remain a key factor shaping the direction of global capital toward safe‑haven assets, which may continue to drain liquidity from emerging markets including Egypt. However, relative stability of local inflation and the central bank’s commitment to hold interest rates steady provide support for domestic liquidity, potentially easing the severity of the downturn.
On the other hand, energy projects announced by BP and Chevron, together with the Egypt‑Africa Fund slated for launch in October, could draw capital flows into energy and non‑bank financial services sectors, creating a potential leadership divide between stocks tied to these themes and those sensitive to the interest‑rate cycle such as real estate and construction.
Summary and Recommendations
- Overall outlook: Neutral to slightly negative in the short term, with a chance of a technical bounce if the market can hold support around 53,500 points for EGX30 and 2,040 points for EGX70.
- Preferred stocks: COMI shows a combination of strong liquidity and technical support; it is worth considering for long‑term positions with a stop‑loss below EGP 67.00.
- Stocks requiring caution: TMGH and SWDY exhibit greater sensitivity to interest rates and global demand; they may be suitable for short‑term trades near support levels with modest profit targets.
- Monitor factors: U.S. Treasury yields, developments in the Strait of Hormuz, and any shift in the U.S. Federal Reserve’s guidance will directly affect risk appetite in the local market.
- Suggested strategy: Allocate investments between financial‑sector leaders (to benefit from steady rates) and limited exposure to energy sectors, while taking advantage of opportunities created by the upcoming Africa fund.
Live Egyptian Equities Coverage
Track real-time quotes, order book market depth, and quantitative technical analytics for all 299 listed companies.
Open Real-Time Market Terminal →