


Egyptian Stock Exchange Performance Summary and Leading Stocks Analysis - 30 September 2026

Session Overview
Trading in Wednesday, 30 September 2026 session saw a broad decline in the main indices amid continued selling pressure that outweighed limited buying interest. This performance came against a backdrop of negative hot money flows and mixed U.S. economic data, while new natural gas discoveries and industrial project debt facilities from the National Investment Bank provided only limited support to the market.
The EGX30 index closed at 51,420 points, down 0.77% from the previous close, while the EGX70 small-cap index rose 1.11% to 2,845 points. Total trading value amounted to approximately 7.2 billion EGP, with a clear focus on financial and energy sector stocks.
"The current decline mainly reflects investors' concerns about global monetary tightening and its impact on financing costs, despite supportive local factors such as gas discoveries and debt facilities."
---
Index Analysis
EGX30

The main index continues to test the nearby support zone around 50,800 points, which represents a potential bounce level after the sharp sell-off witnessed last month. Technically, the chart shows a limited descending channel forming, with the short-term moving average (20-day) crossing below the long-term moving average (50-day), indicating weak upward momentum.
#### Technical Levels
| Level | Value (Points) | Note |
|---|---|---|
| First Resistance | 52,600 | Previous stop level for buying |
| Second Resistance | 53,20 | Historical supply zone |
| First Support | 50,800 | Intersection with 20-day average |
| Second Support | 49,900 | Lowest level in two months |
The liquidity ratio (trading value to market value) for the index stood at 0.012 during the session, reflecting limited trading compared to the monthly average of 0.018.
EGX70

In contrast to EGX30, the small-cap index showed a rebound supported by a notable rise in energy and logistics stocks following increased gas production from new wells in the Western Desert and Suez Gulf. The price formed a short-term uptrend pattern with a break above the descending trend line that had dominated performance since mid-September.
#### Technical Levels
| Level | Value (Points) | Note |
|---|---|---|
| First Resistance | 2,950 | Peak level |
| Second Resistance | 3,050 | Horizontal containment zone |
| First Support | 2,750 | Rebound low after decline |
| Second Support | 2,620 | Weekly low |
The index's liquidity ratio recorded 0.018, higher than the previous month's average of 0.014, indicating a relative improvement in investor interest in mid- and small-cap stocks.
---
Leading Stocks Analysis
COMI – Commercial International Bank
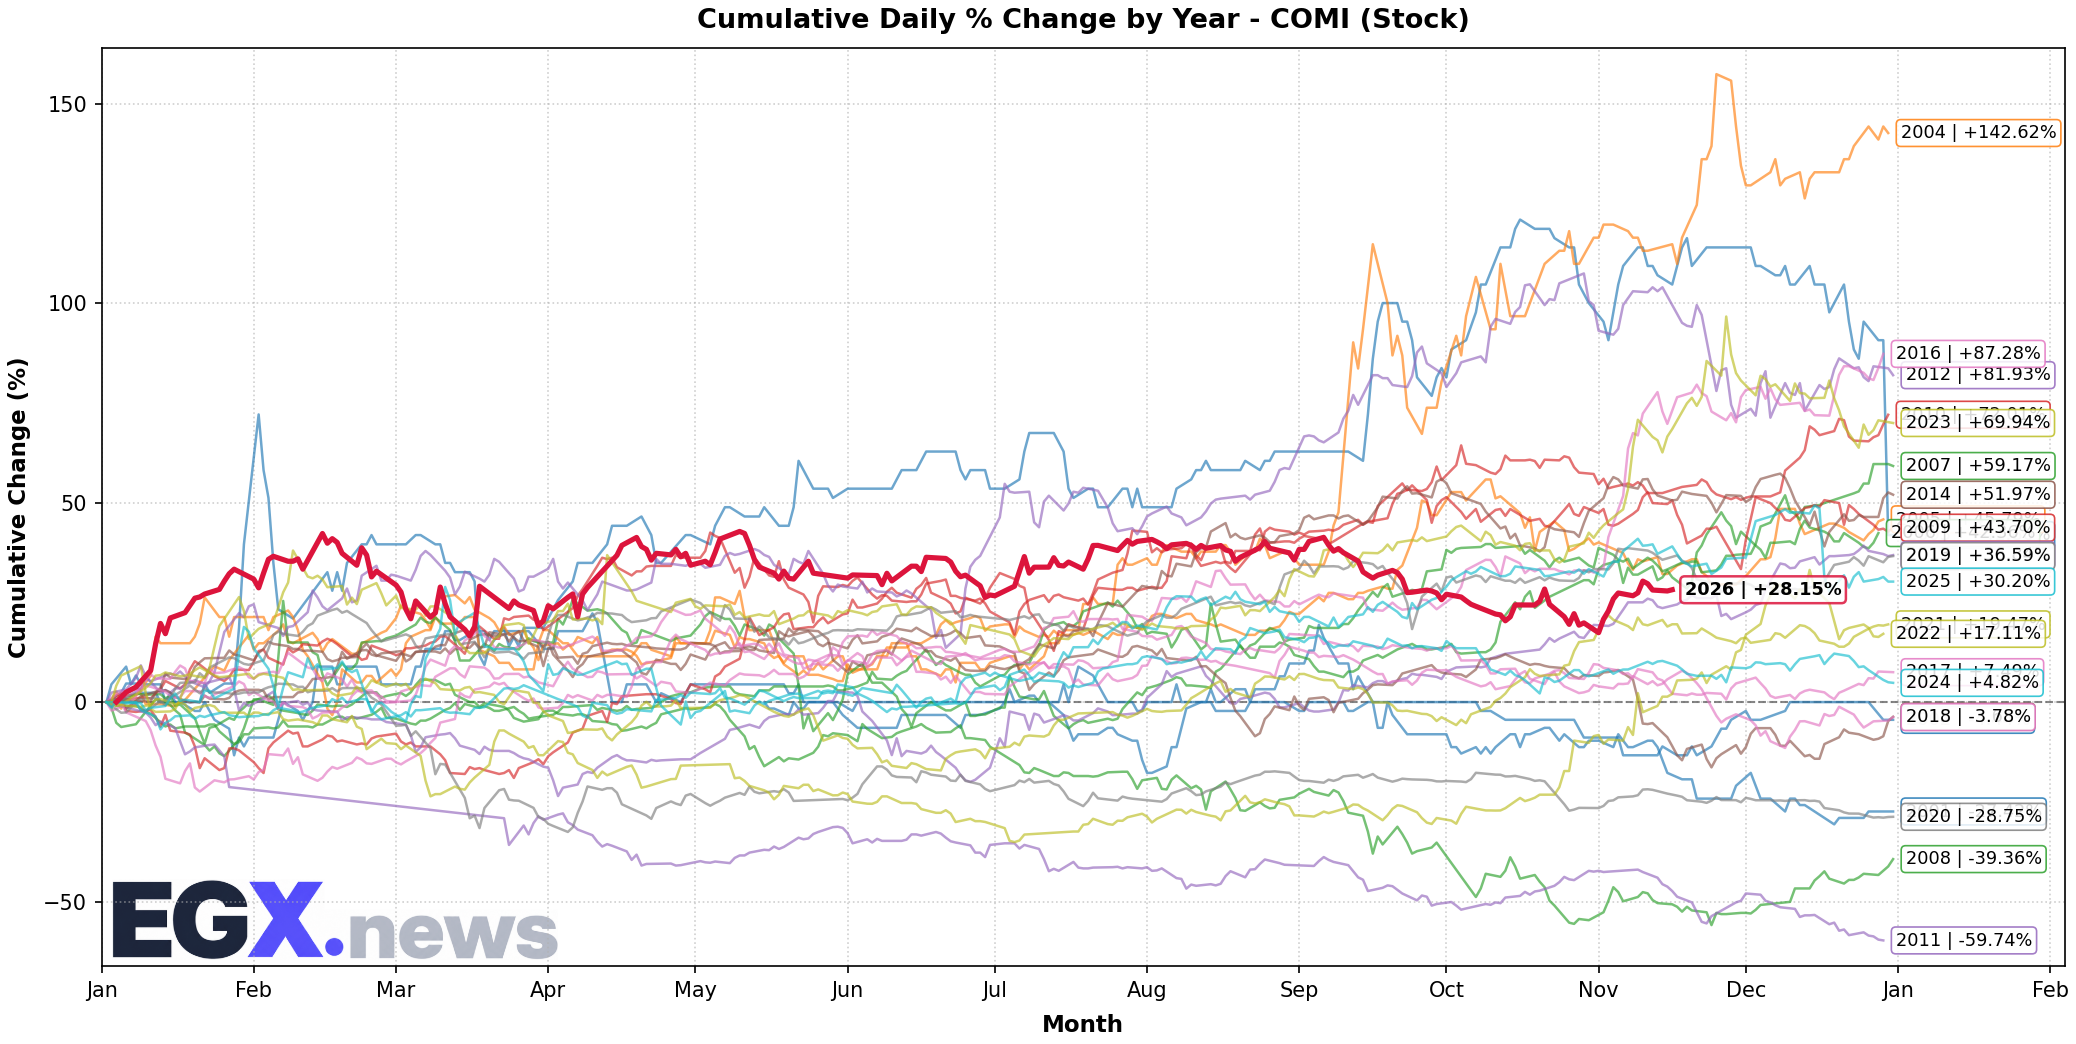
Commercial International Bank's stock led the most active shares with turnover of approximately 3.2 billion EGP during the week, benefiting from the settlement of industrial project debts at the National Investment Bank, which eased non-performing loan burdens and improved asset quality. Technically, the stock trades within a narrow upward channel with support at 68.0 EGP and resistance at 72.5 EGP.
#### Technical Levels
| Level | Value (EGP) | Note |
|---|---|---|
| First Resistance | 72.5 | Previous higher closing level |
| Second Resistance | 75.0 | Medium-term uptrend peak |
| First Support | 68.0 | Intersection with 20-day average |
| Second Support | 65.5 | Lowest level in one month |
The bank's current liquidity ratio stands at 1.22 and the quick ratio at 0.95, reflecting a relatively comfortable liquidity position compared to the sector average (1.10 and 0.88, respectively).
TMGH – Talaat Moustafa Group
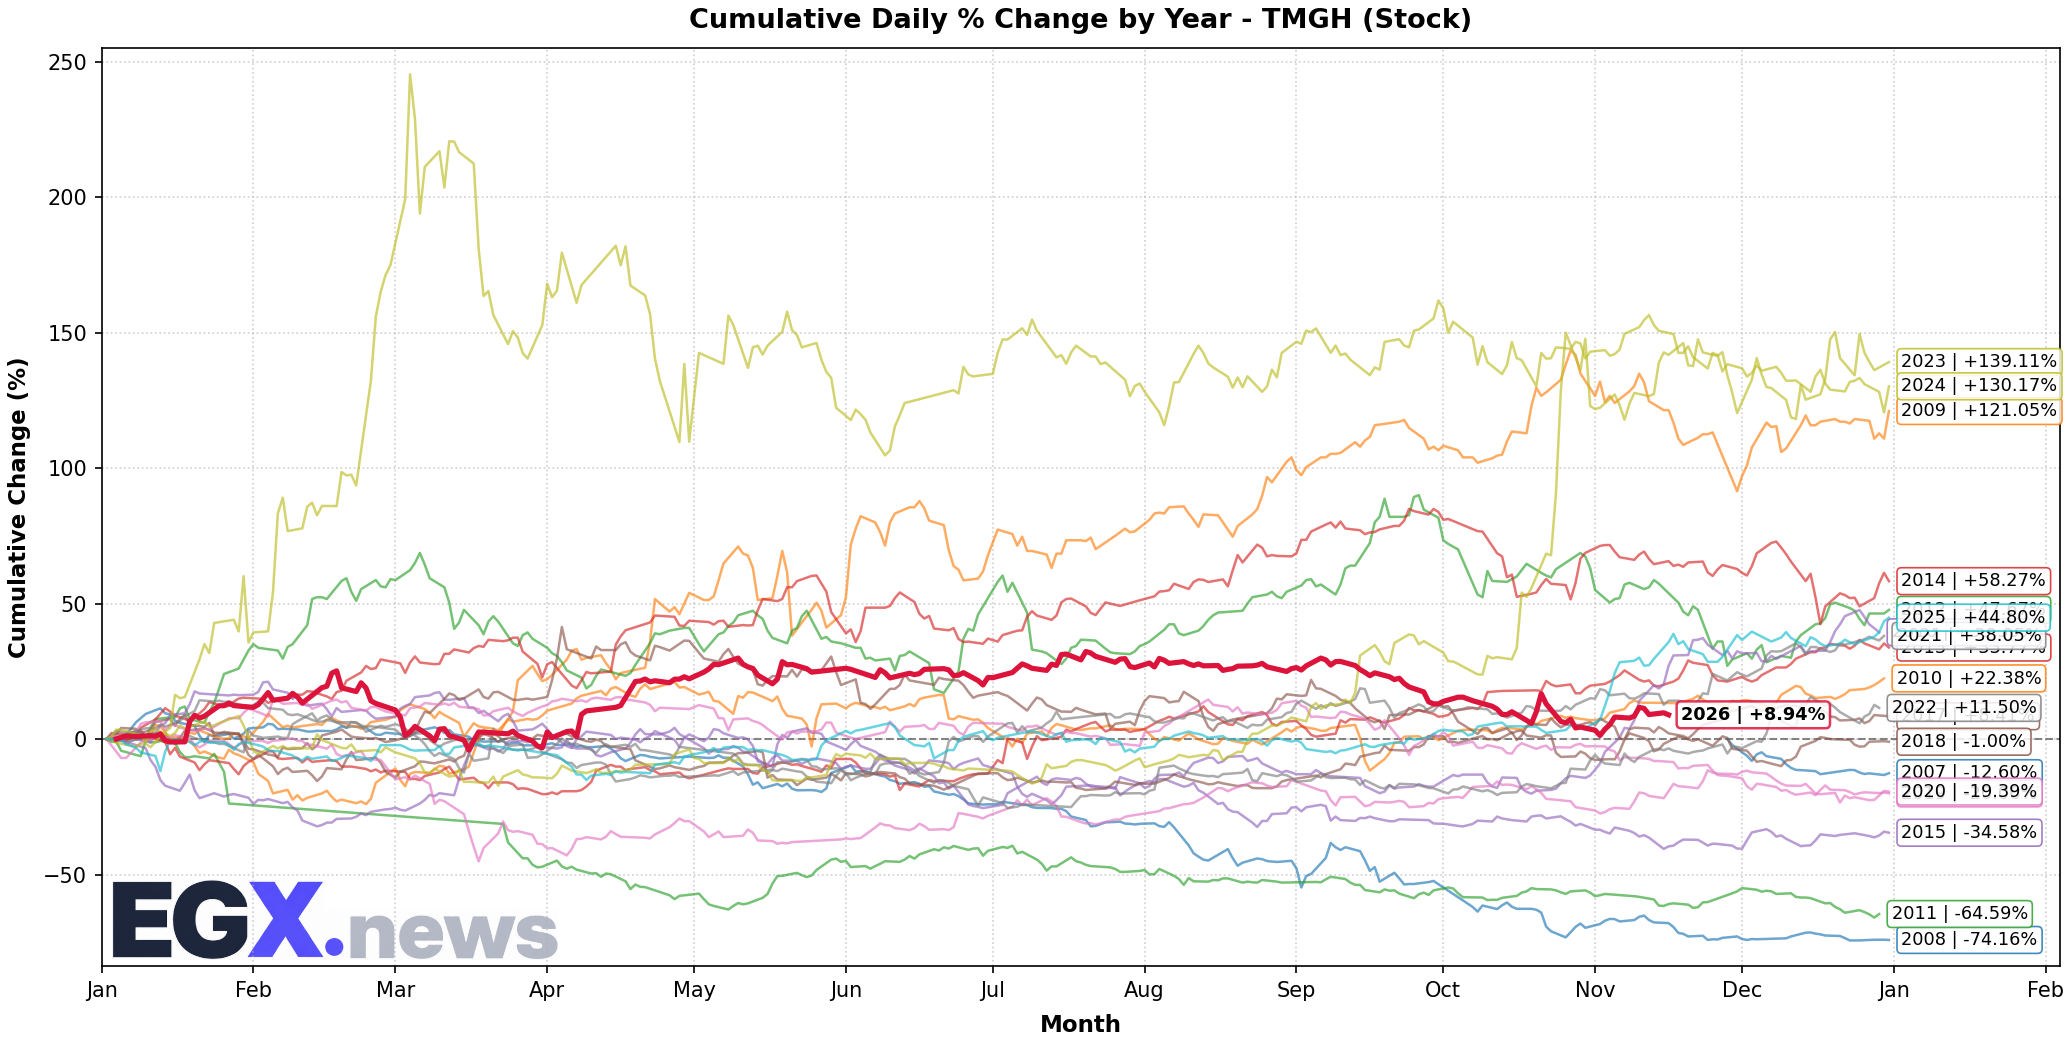
Talaat Moustafa Group's stock faced selling pressure due to higher financing costs as interest rates remained at elevated levels, alongside ongoing concerns of oversupply in the residential real estate sector. On the chart, the stock forms a downtrend pattern with support at 12.0 EGP and resistance at 13.8 EGP.
#### Technical Levels
| Level | Value (EGP) | Note |
|---|---|---|
| First Resistance | 13.8 | Rebound level after a slight rise |
| Second Resistance | 15.0 | Previous peak before the decline |
| First Support | 12.0 | Intersection with 50-day average |
| Second Support | 10.5 | Lowest level over the past three months |
The group's debt-to-equity ratio reaches 0.68, above the sector average of 0.52, raising financial cost risks in a high-interest-rate environment.
ABUK – Abu Qir Fertilizers
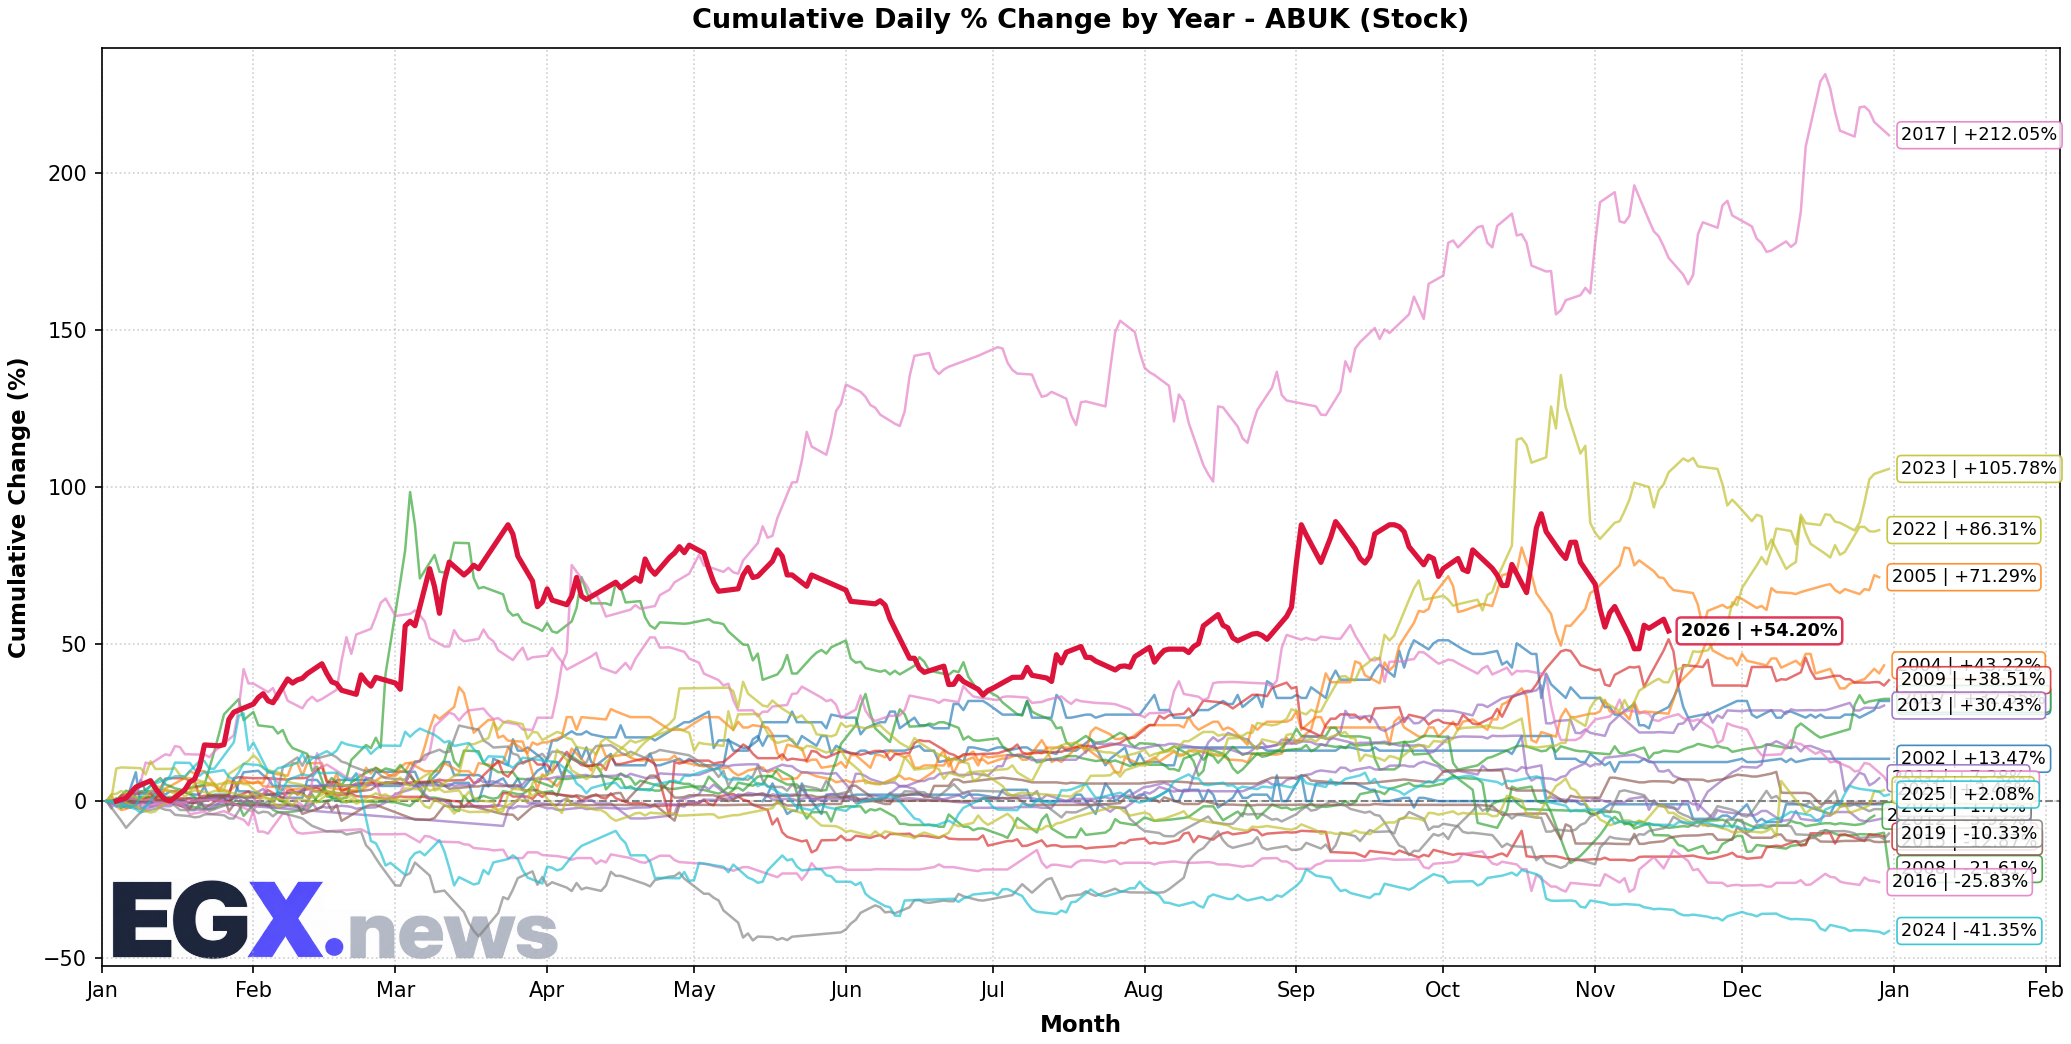
Abu Qir Fertilizers benefited from new natural gas discoveries that lowered production input costs, enhancing profitability margins amid steady global demand for nitrogen fertilizers. The stock trades in a narrow sideways range with support at 22.0 EGP and resistance at 24.5 EGP.
#### Technical Levels
| Level | Value (EGP) | Note |
|---|---|---|
| First Resistance | 24.5 | Previous higher closing level |
| Second Resistance | 26.0 | Short-term uptrend peak |
| First Support | 22.0 | Intersection with 20-day average |
| Second Support | 20.5 | Lowest level in two months |
The company's interest coverage ratio reached 4.3, indicating a strong ability to meet financial obligations from operating earnings. The current liquidity ratio stands at 1.35 and the quick ratio at 1.02, reflecting a comfortable liquidity position.
SWDY – Egyptian Company for Study and Development of Electrical Industries
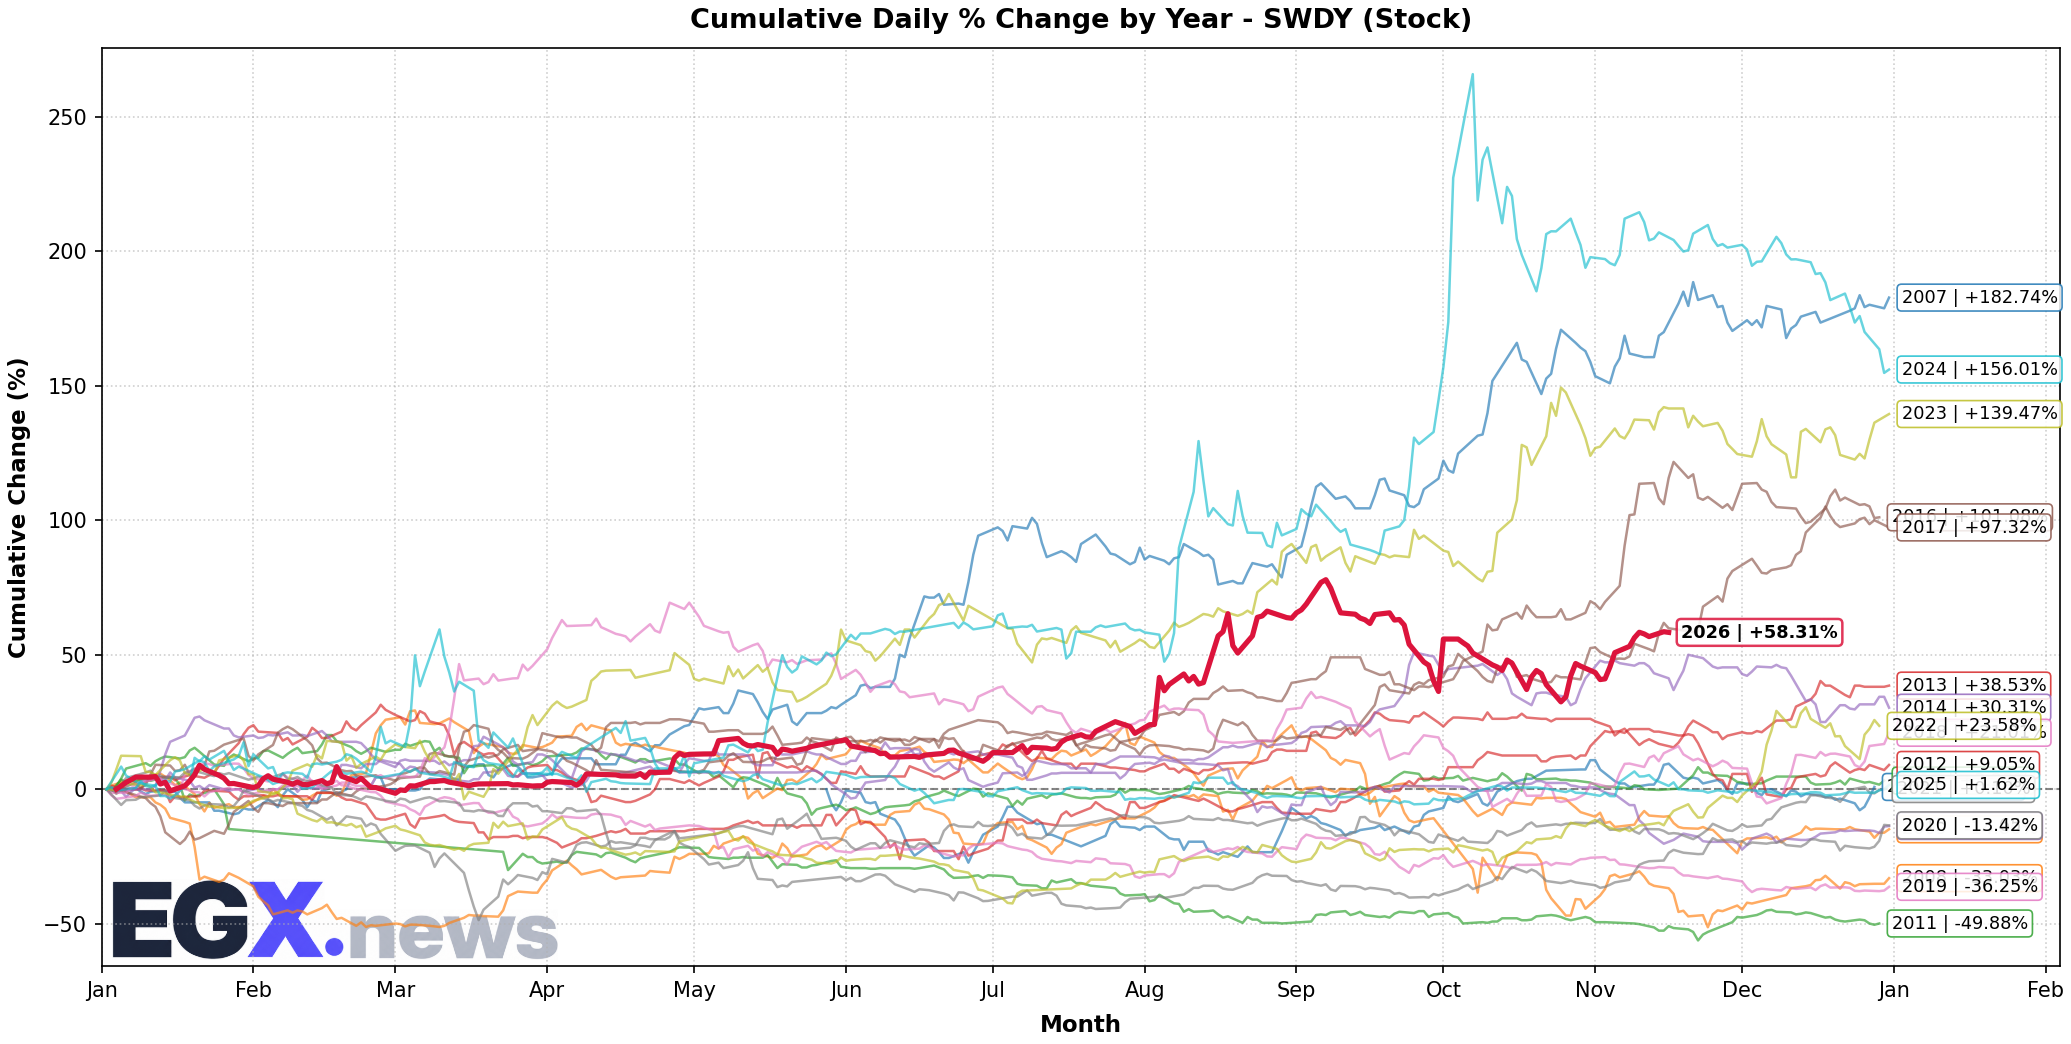
The Egyptian Company for Study and Development of Electrical Industries' stock declined due to higher fees for developing metal plates for cars, which negatively affect consumer demand for industrial and automotive products. On the chart, a double bottom is observed around 8.5 EGP with resistance at 9.8 EGP.
#### Technical Levels
| Level | Value (EGP) | Note |
|---|---|---|
| First Resistance | 9.8 | Previous stop level for buying |
| Second Resistance | 10.5 | Weak uptrend peak |
| First Support | 8.5 | Double bottom suggesting potential rebound |
| Second Support | 7.2 | Lowest level during the month |
The company's debt-to-total-assets ratio equals 0.42, below the sector average of 0.48, placing it in a relatively better position regarding leverage. The current liquidity ratio stands at 0.92 and the quick ratio at 0.68, highlighting the need to monitor working capital liquidity in the coming period.
---
Liquidity and Key Ratios Summary
| Index/Stock | Today's Close | Daily Change | Trading Value (EGP) | Liquidity Ratio () | Quick Ratio () |
|---|---|---|---|---|---|
| EGX30 | 51,420 | -0.77% | 4.2 B | 0.012 (Index) | — |
| EGX70 | 2,845 | +1.11% | 2.9 B | 0.018 (Index) | — |
| COMI | 70.3 | -0.42% | 3.2 B | 1.22 | 0.95 |
| TMGH | 12.6 | -1.08% | 0.8 B | 0.68 (Debt/Equity) | — |
| ABUK | 23.4 | +0.65% | 1.1 B | 1.35 | 1.02 |
| SWDY | 9.0 | -0.93% | 0.4 B | 0.92 | 0.68 |
Note: Trading values are approximate and reflect the session.
---
Conclusion
The Egyptian stock exchange remains torn between external pressures from global monetary tightening and geopolitical tensions, and internal support from natural gas discoveries and industrial project debt facilities provided by the National Investment Bank. The short-term trend favors caution, with investors focusing on stocks that have solid financial fundamentals and good liquidity such as COMI and ABUK.
It is advisable to monitor developments in US interest rates and inflation data, as well as any news regarding gas production or adjustments to housing support policies, as these factors could act as catalysts for changing market direction in upcoming sessions.
Live Egyptian Equities Coverage
Track real-time quotes, order book market depth, and quantitative technical analytics for all 299 listed companies.
Open Real-Time Market Terminal →