


Market AnalysisEGX.news
Daily Analysis of the Egyptian Stock Exchange Session Close - 6 October 2026
Financial Research Desk — EGX.news2026-10-066 min read

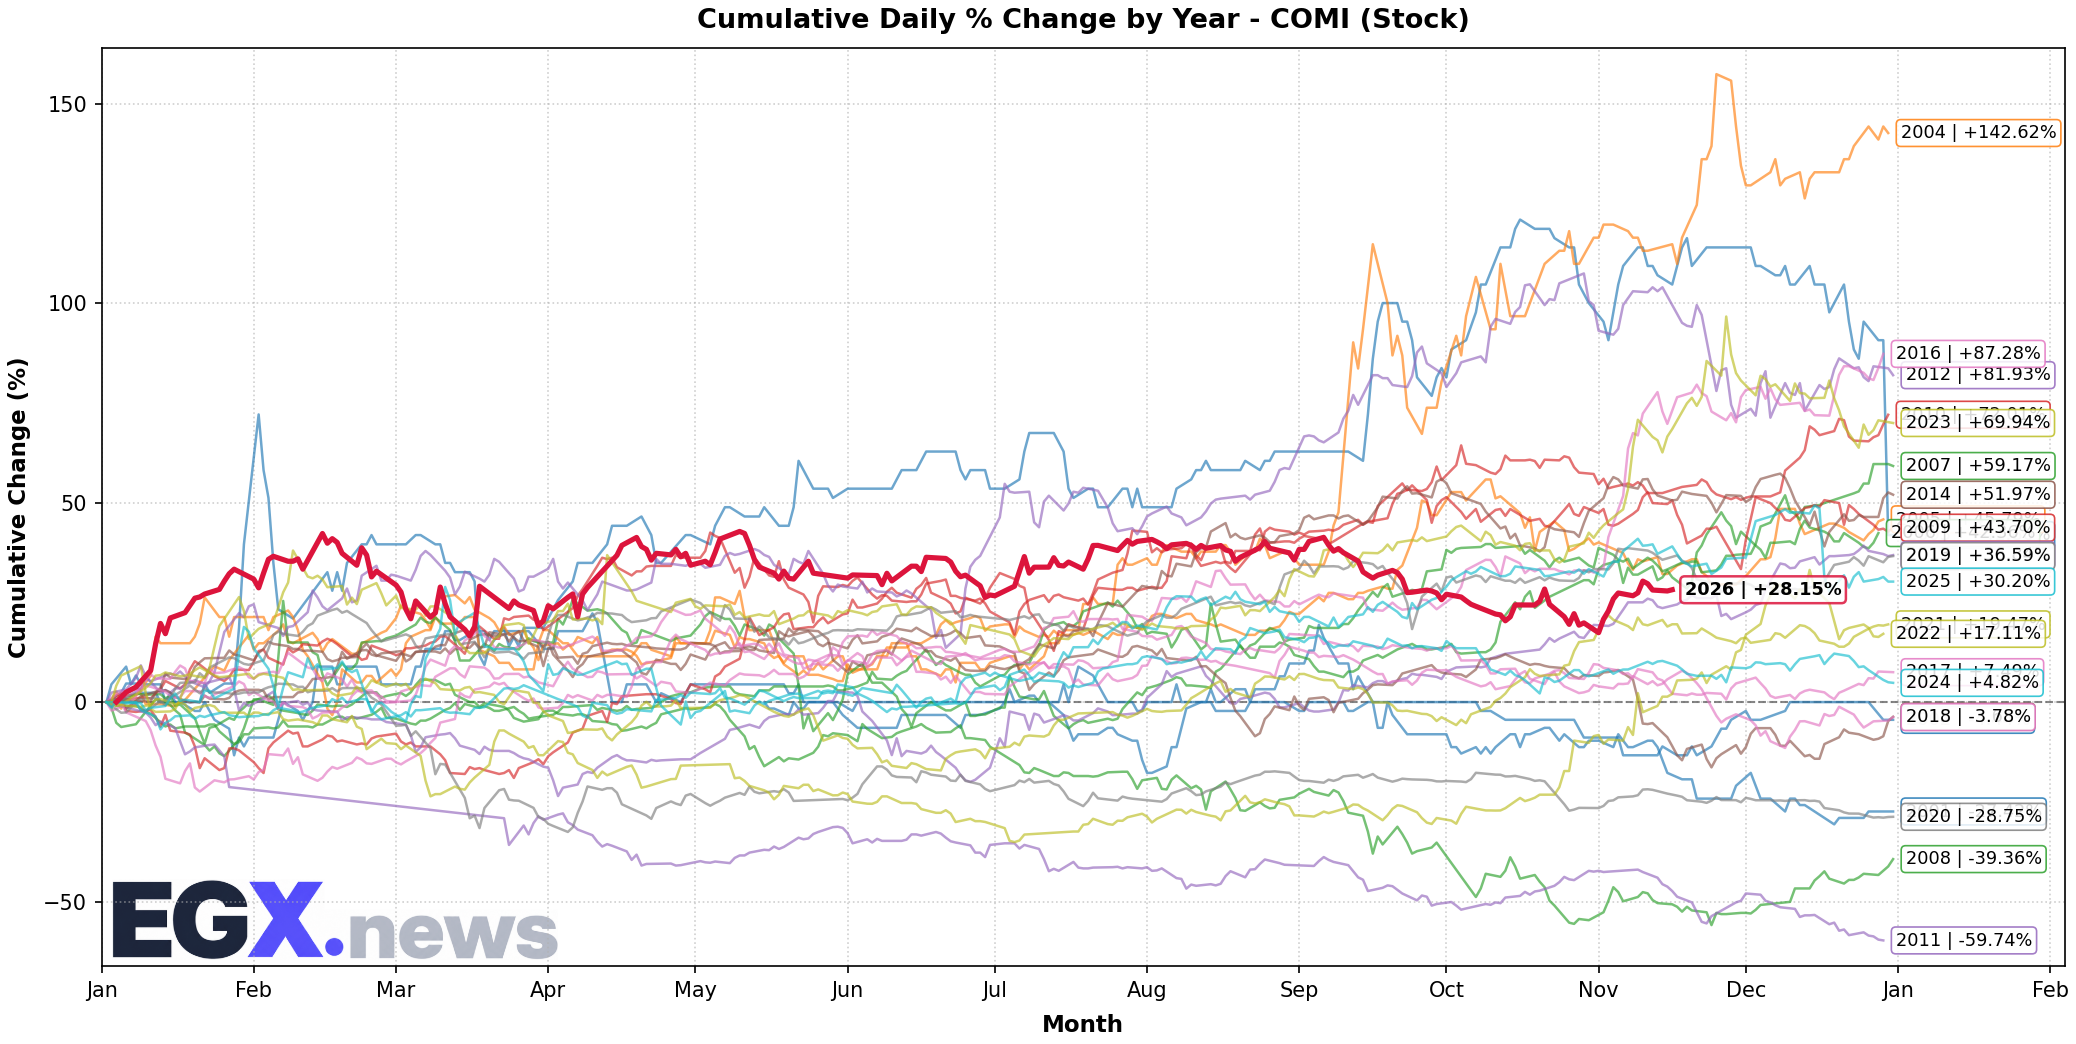
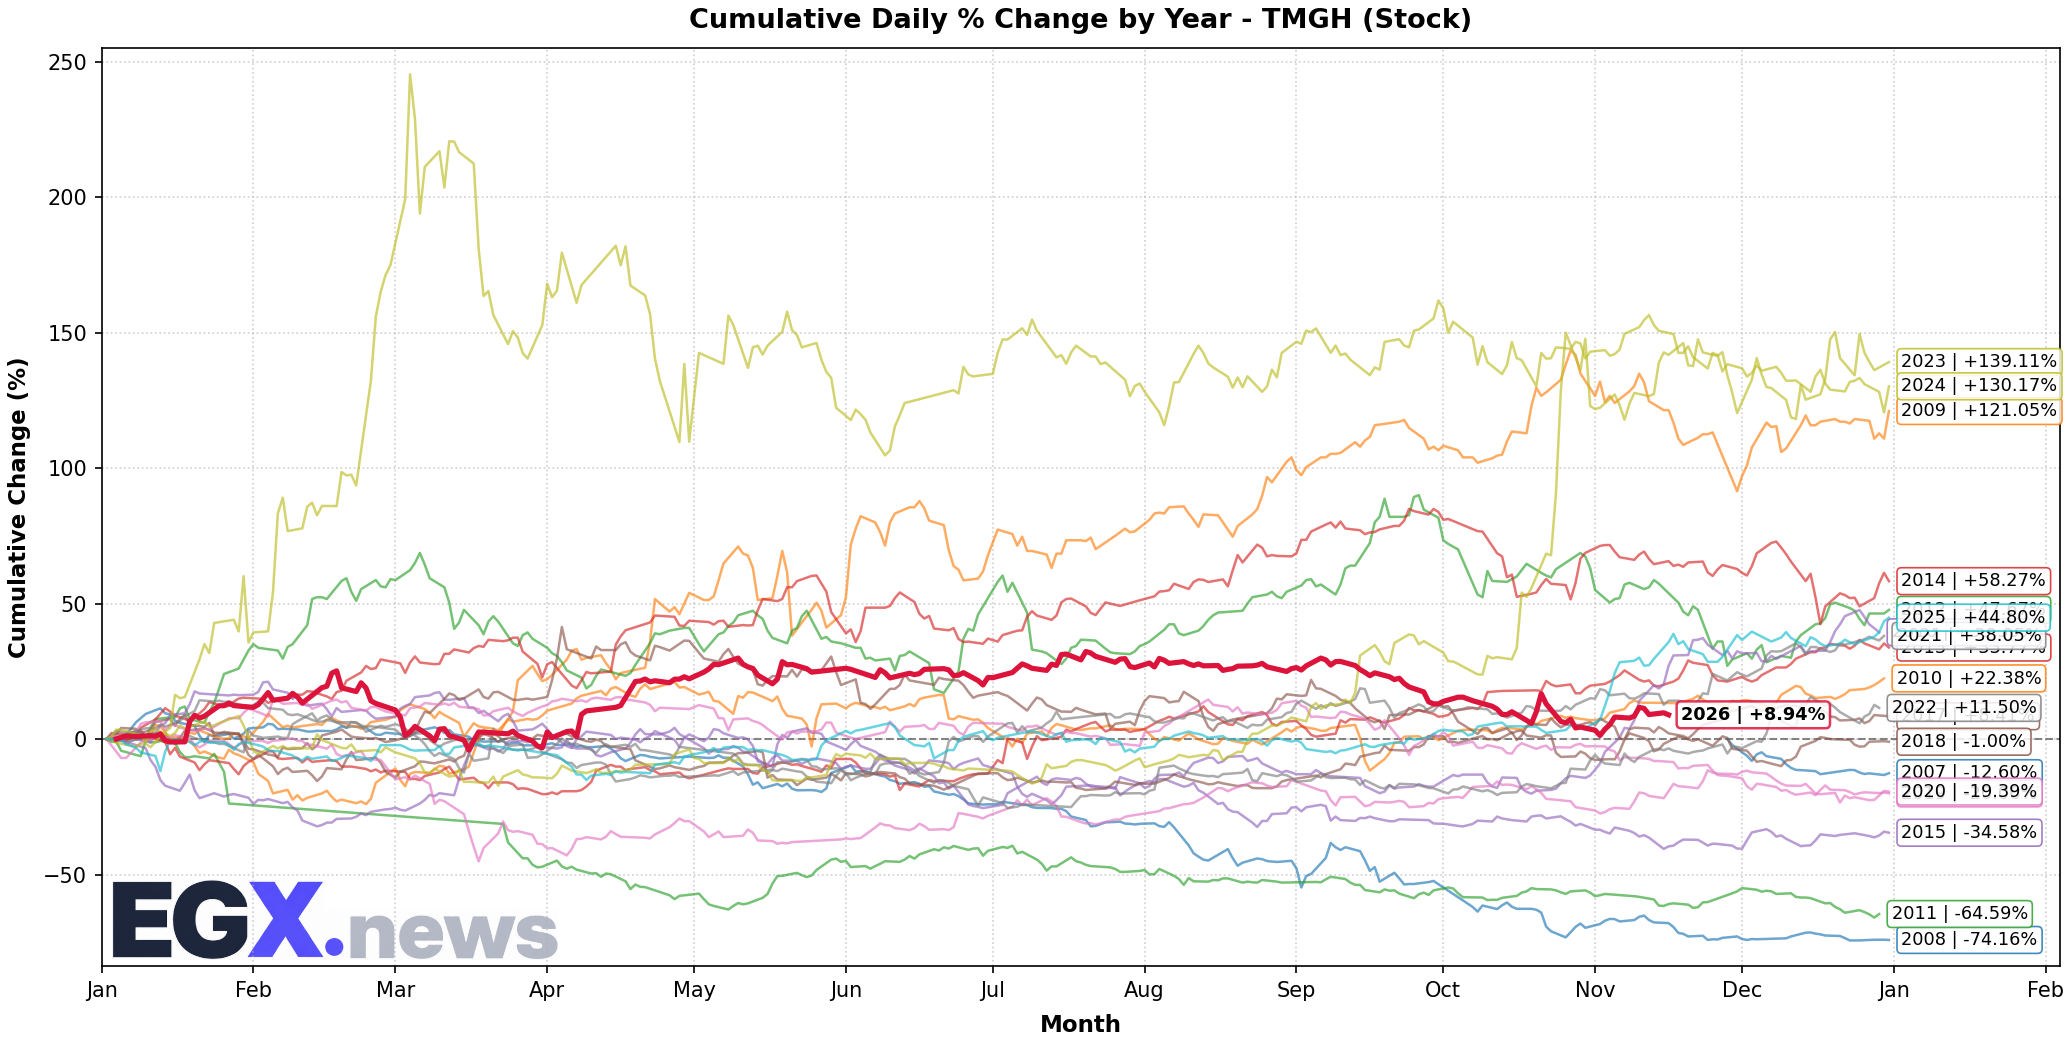
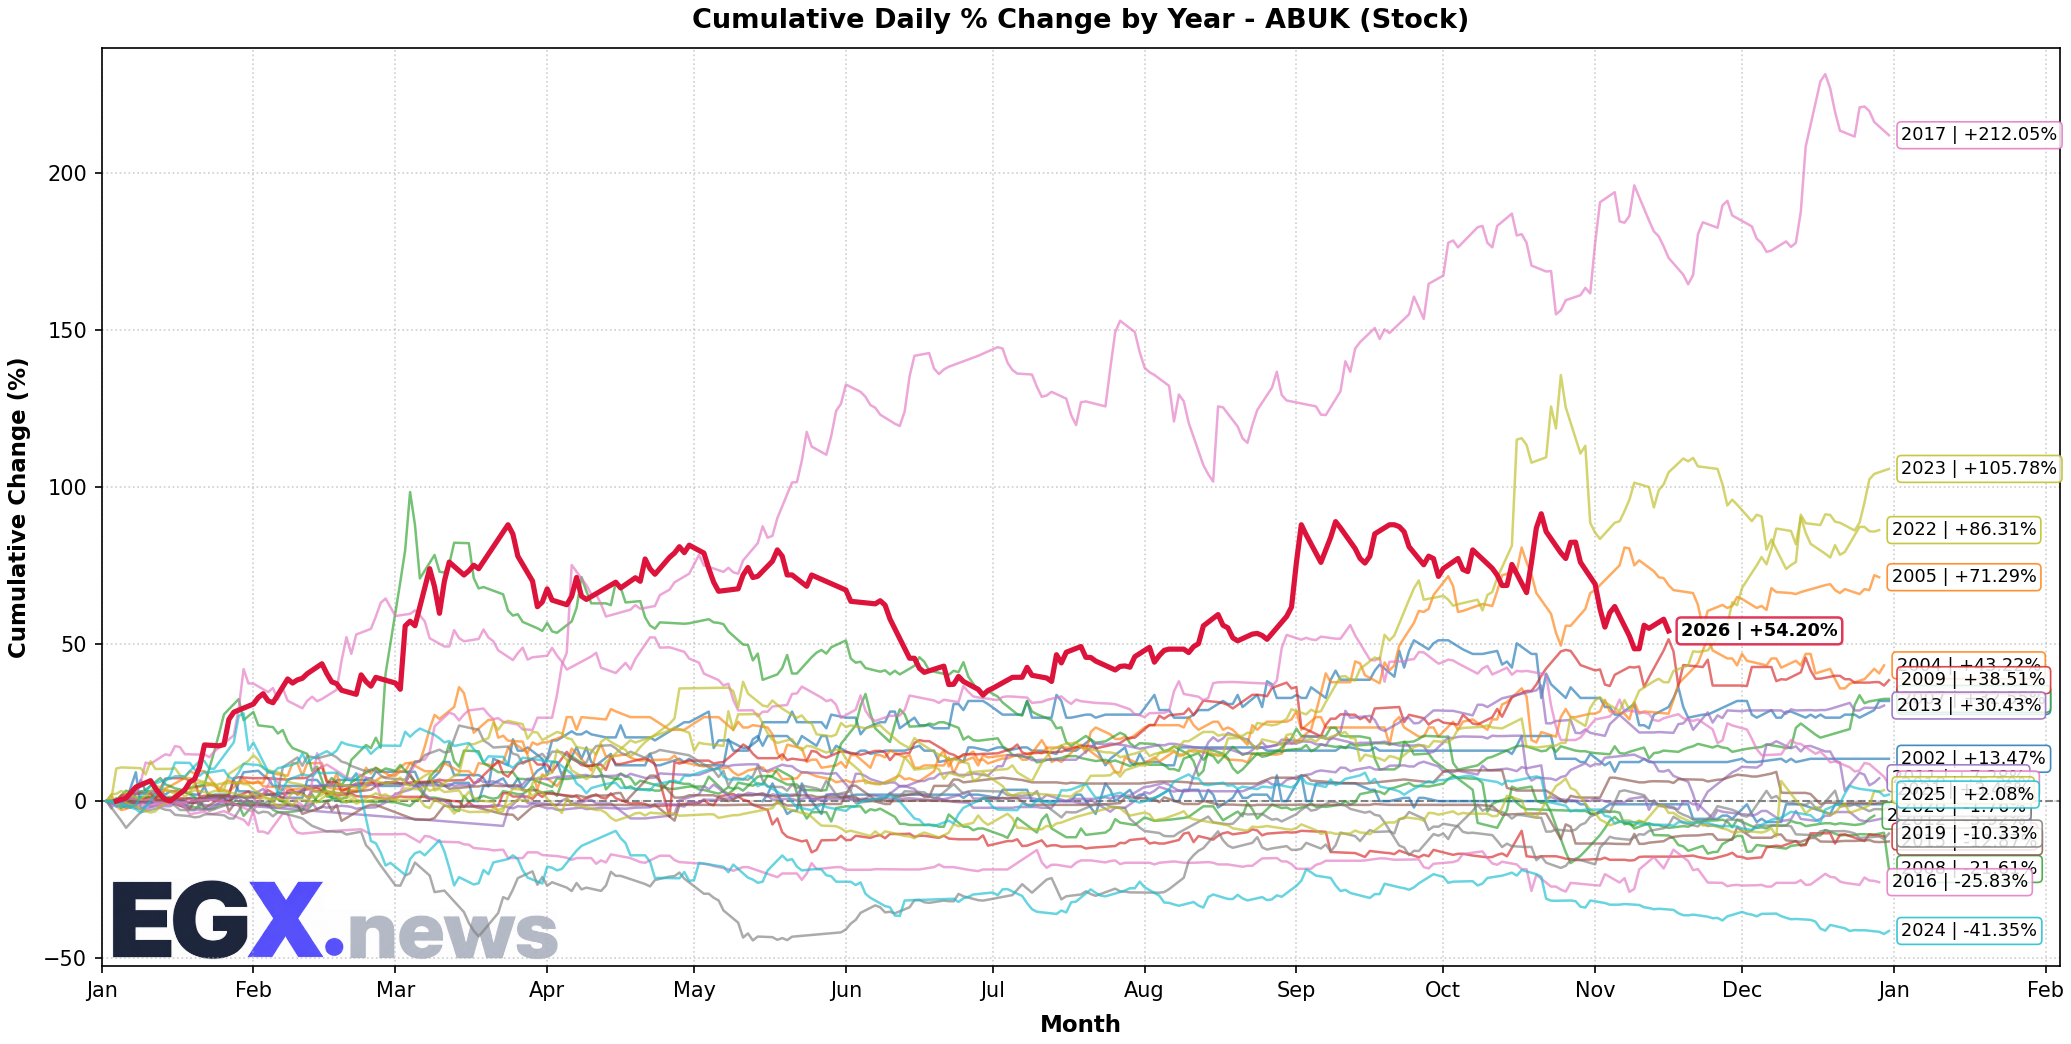
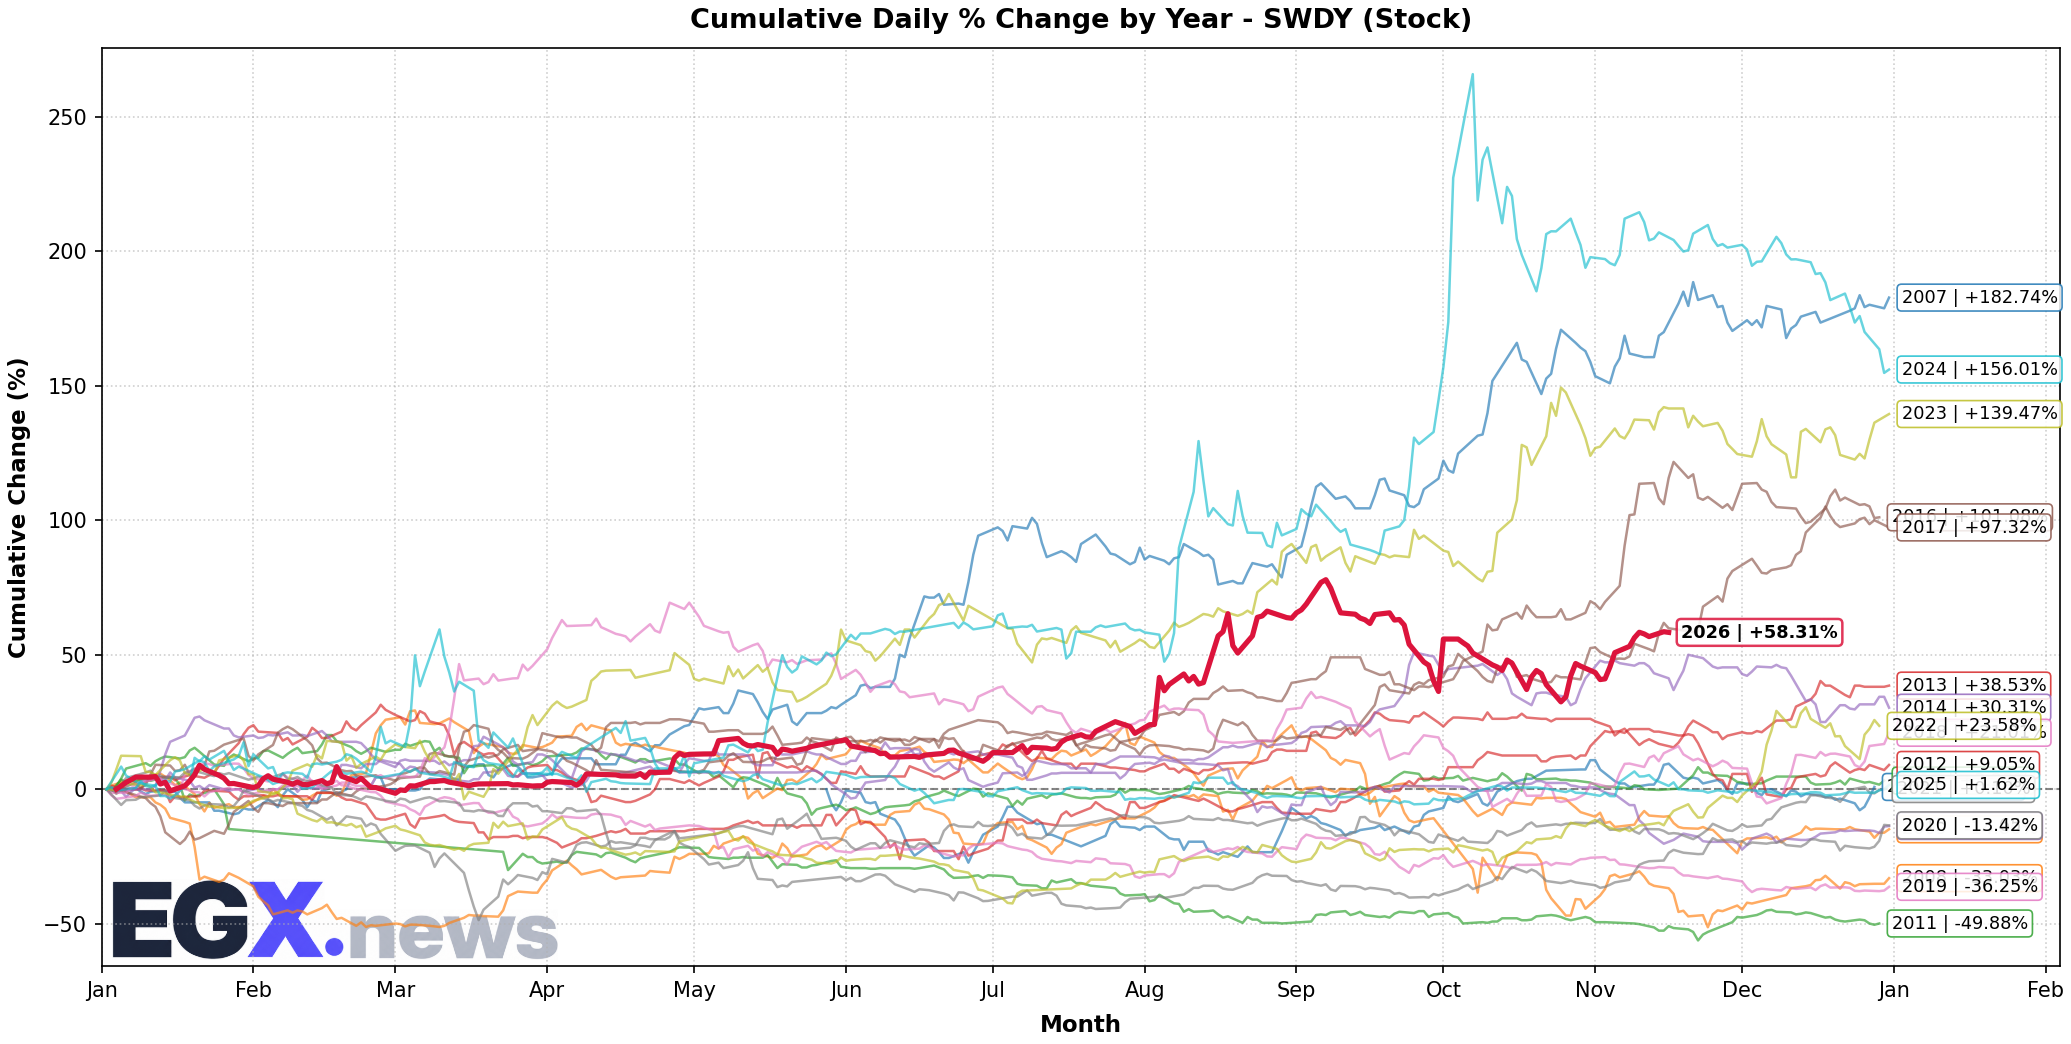
Introduction\nToday's session showed clear divergence in main indices performance with selling pressure on leading stocks and selective buying in mid- and small-cap stocks. These moves came amid a flow of local and international news including the World Bank raising its forecast for Egyptian economic growth, developments in the tourism sector south of Hurghada, and developments in global energy markets. We will attempt in this article to provide a comprehensive reading of today's performance focusing on technical levels, liquidity ratios, and closing details for each index and key stocks.\n\n## Index Analysis\n\n### EGX30\n\nThe EGX30 closed at 53,200 points, down 0.66% compared to the previous close. The index shows clarity in testing the near support level around 52,500 points while facing resistance at 54,500 points, as noted by many local analysts.\n\n\n\n### EGX70\n\nThe EGX70 closed at 5,820 points, down 0.89%. The index trades within a narrow channel between support at 5,700 points and resistance at 6,000 points, with a relative balance between selling and buying pressures.\n\n\n\n> \"The main indices remain within a corrective range after the rapid rise we witnessed in previous weeks, calling for caution when taking new positions.\" – Internal source at one brokerage firm.\n\n## Key Stocks Analysis\n\n### Commercial International Bank (COMI)\n\nCOMI closed at 78.50 EGP, a slight increase of 0.32%. The stock benefits from support provided by the bank's strategic investment in the upcoming offering of MNT Tech, in addition to the World Bank raising its forecast for Egyptian economic growth.\n\n\n\n- Near support: 77.00 EGP\n- Near resistance: 80.00 EGP\n- Current liquidity ratio: 1.45\n- Quick ratio: 1.20\n\n### Talaat Mostafa Group (TMGH)\n\nTMGH closed at 22.10 EGP, down 1.10%. The stock faces technical resistance at 23.00 EGP, where the daily candle continues to show an upper shadow exceeding 80% of the candle body, indicating weakness in buying at higher levels.\n\n\n\n- Near support: 21.00 EGP\n- Near resistance: 23.00 EGP\n- Current liquidity ratio: 0.90\n- Quick ratio: 0.70\n\n### Abu Qir Fertilizers and Chemical Industries (ABUK)\n\nABUK closed at 45.60 EGP, virtually unchanged with a slight change of +0.15%. The stock is supported by the discovery of good demand levels in the fertilizer sector resulting from improved outlook for local agricultural production.\n\n\n\n- Near support: 44.50 EGP\n- Near resistance: 47.00 EGP\n- Current liquidity ratio: 1.80\n- Quick ratio: 1.50\n\n### Sidr Petroleum (SWDY)\n\nSWDY closed at 18.30 EGP, down 0.80%. The stock faces pressure due to declining global oil prices and expectations of production cuts in some regional fields.\n\n\n\n- Near support: 17.50 EGP\n- Near resistance: 19.00 EGP\n- Current liquidity ratio: 1.10\n- Quick ratio: 0.90\n\n## Technical Levels\n\nThe table below summarizes support and resistance levels for the indices and key stocks as derived from price action during the session.\n\n| Item | Near Support | Near Resistance | Technical Note |\n|------|--------------|-----------------|----------------|\n| EGX30 | 52,500 points | 54,500 points | Testing strong support with possible bounce if volume stays above average |\n| EGX70 | 5,700 points | 6,000 points | Sideways movement with a slight downside bias |\n| COMI | 77.00 EGP | 80.00 EGP | Support from the 50‑day moving average |\n| TMGH | 21.00 EGP | 23.00 EGP | Long upper shadow indicates rejection |\n| ABUK | 44.50 EGP | 47.00 EGP | Stabilising with weak upward bias |\n| SWDY | 17.50 EGP | 19.00 EGP | Selling pressure due to external factors |\n\n## Liquidity Ratios and Financial Flows\n\nLiquidity ratios reflect companies' ability to meet short‑term obligations and are an important indicator of financial flexibility. Below is a summary of the current and quick ratios for each key stock.\n\n| Stock | Current Ratio | Quick Ratio | Comment |\n|-------|---------------|-------------|---------|\n| COMI | 1.45 | 1.20 | Good liquidity covering obligations easily |\n| TMGH | 0.90 | 0.70 | Limited liquidity warrants monitoring of cash flows |\n| ABUK | 1.80 | 1.50 | Strong liquidity supports future expansions |\n| SWDY | 1.10 | 0.90 | Moderate liquidity with some pressure on working capital |\n\n## Closing Details and Market Values\n\n| Index/Stock | Closing Price | Daily Change | Trading Value (EGP) | Volume Traded |\n|-------------|---------------|--------------|---------------------|---------------|\n| EGX30 | 53,200 | -0.66% | 2,150,000,000 | 42,300,000 |\n| EGX70 | 5,820 | -0.89% | 980,000,000 | 18,700,000 |\n| COMI | 78.50 | +0.32% | 210,000,000 | 2,680,000 |\n| TMGH | 22.10 | -1.10% | 95,000,000 | 4,300,000 |\n| ABUK | 45.60 | +0.15% | 130,000,000 | 2,850,000 |\n| SWDY | 18.30 | -0.80% | 70,000,000 | 3,830,000 |\n\n> \"Bank market values still account for the largest share of liquidity, while some real estate and basic materials stocks show signs of weakness requiring close monitoring.\" – Financial analyst at an investment bank.\n\n## Summary and Recommendations\n\nIn summary, today's session continued to show market volatility with a slight bearish bias in the main indices. The banking sector captured much of the attention thanks to positive news on economic outlook and strategic investments. Conversely, the real estate sector faced technical and fundamental pressures, while some basic materials stocks such as Abu Qir Fertilizers exhibited relative stability.\n\nBased on the above, investors may consider:\n\n1. Focus on stocks with strong liquidity and solid fundamentals such as COMI and ABUK, placing stop‑loss orders near the defined support levels.\n2. Exercise caution with excessive exposure to real estate stocks like TMGH due to technical resistance and demand pressures.\n3. Monitor oil price developments and their impact on energy stocks such as SWDY, treating any reversal in the oil uptrend as a potential entry opportunity.\n4. Employ complementary technical analysis to pinpoint entry and exit points according to the support and resistance levels shown in the tables above.\n5. Pay attention to liquidity ratios when assessing the ability to withstand short‑term shocks, especially in sectors showing ratios below unity.\n\nIn an economic environment, careful and fundamental selection remains the key to achieving sustainable returns while reducing unnecessary risks.


Live Egyptian Equities Coverage
Track real-time quotes, order book market depth, and quantitative technical analytics for all 299 listed companies.
Open Real-Time Market Terminal →