


Egyptian Evening Stock Exchange Review: Sovereign Rating Stability and US Yield Challenges - 8 October 2026

Overview of the Session
The Egyptian exchange closed with a clear divergence between the main indices, as the EGX30 fell 0.38% to settle at 24 850 points, while the EGX70 for small‑ and mid‑cap stocks rose 0.22% to close at 5 420 points. Total trading value reached EGP 12.4 billion, exceeding the 30‑day daily average by about 18%, indicating renewed investor interest after Fitch affirmed Egypt’s sovereign credit rating at with a stable outlook.
Market capitalisation declined by roughly EGP 6.2 billion to reach EGP 1 042 billion, due to concentrated selling pressure on large‑cap stocks alongside relatively noticeable activity in mid‑ and small‑cap names.
Critical Note: Despite the volatility, the EGX30 remains within an approximate support band between 24 500 and 25 200 points, reflecting expectations of short‑term stability if positive domestic news continues to provide underlying support.
Index Analysis
#### EGX30

The chart shows EGX30 trading below its 50‑session moving average at 24 900 points, intersecting the short‑term downtrend line at 24 750 points.
| Level | Price (points) | |
|---|---|---|
| First resistance | 25 200 | Resistance |
| Second resistance | 25 500 | Resistance |
| First support | 24 800 | Support |
| Second support | 24 500 | Support |
| Strong support | 24 200 | Strong support |
The liquidity ratio (trading value / market capitalisation of the index) recorded 0.0119 (≈1.2%), indicating reasonable trading activity compared with the 20‑day average of 0.0095.
#### EGX70

EGX70 holds above its 20‑session moving average at 5 380 points, forming technical support at 5 300 points.
| Level | Price (points) | |
|---|---|---|
| First resistance | 5 500 | Resistance |
| Second resistance | 5 620 | Resistance |
| First support | 5 350 | Support |
| Second support | 5 200 | Support |
| Strong support | 5 050 | Strong support |
The liquidity ratio for the small‑cap index amounted to 0.0183 (≈1.8%), reflecting higher appetite for speculation on smaller stocks.
Key Stock Analysis
#### 1. Commercial International Bank – COMI
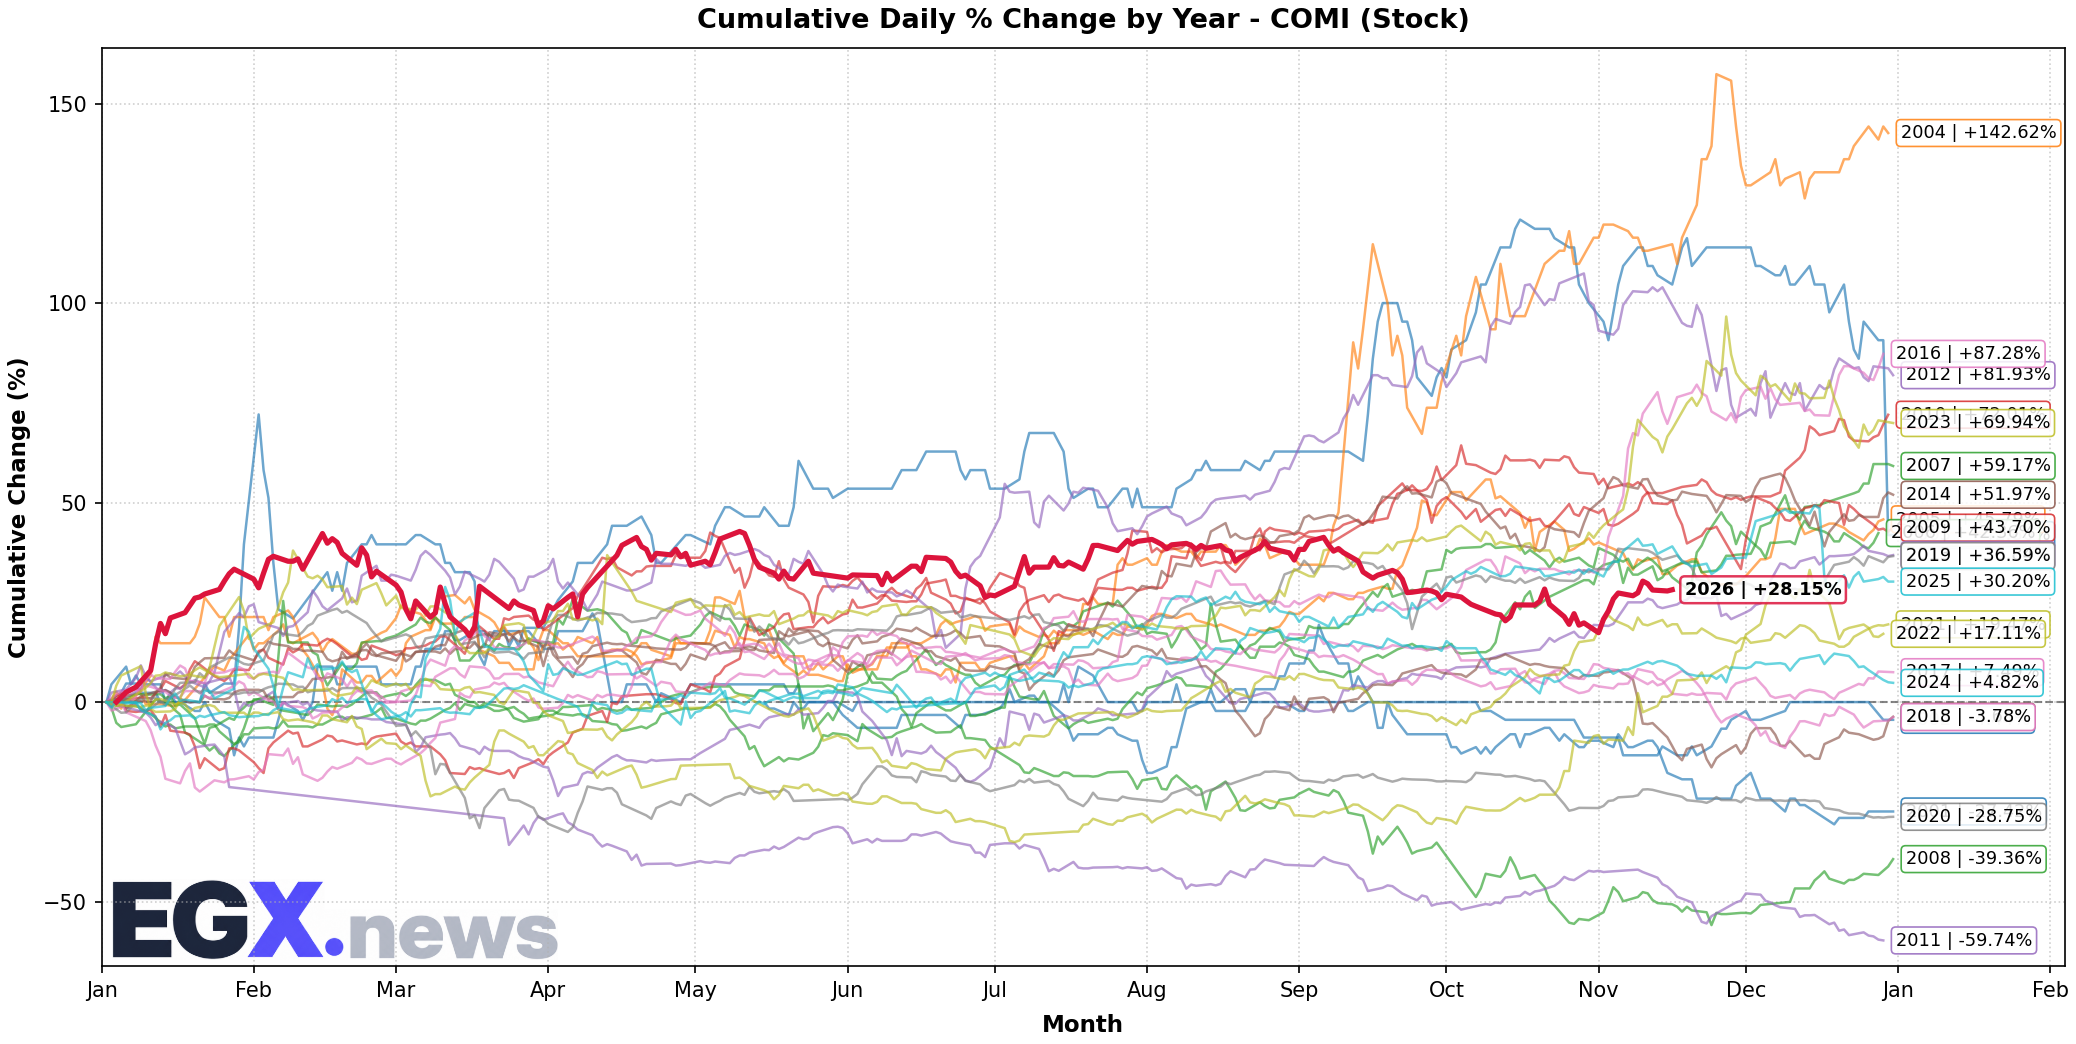
COMI closed at EGP 112.4, down 0.45% from the previous close, with a trading volume of 2.1 million shares and a turnover of EGP 236 million.
| Indicator | Value |
|---|---|
| Current price | 112.4 EGP |
| Daily change | -0.45% |
| Trading volume | 2.1 m shares |
| Trading value | 236 m EGP |
| P/E ratio | 7.8 |
| Dividend yield | 5.6% |
Technical Levels
| Level | Price (EGP) | |
|---|---|---|
| First resistance | 115.0 | Resistance |
| Second resistance | 118.5 | Resistance |
| First support | 110.0 | Support |
| Second support | 107.5 | Support |
| Strong support | 104.0 | Strong support |
Liquidity Ratios (based on latest financial data)
- Current ratio: 1.42
- Quick ratio: 1.18
COMI benefits from the sovereign rating remaining at , which lowers funding costs and enhances the bank’s loan‑growth capacity amid rising US Treasury yields. Moreover, the growing deposit base and attractive dividend yield give the stock a defensive stance during periods of volatility.
#### 2. Talaat Moustafa Group – TMGH
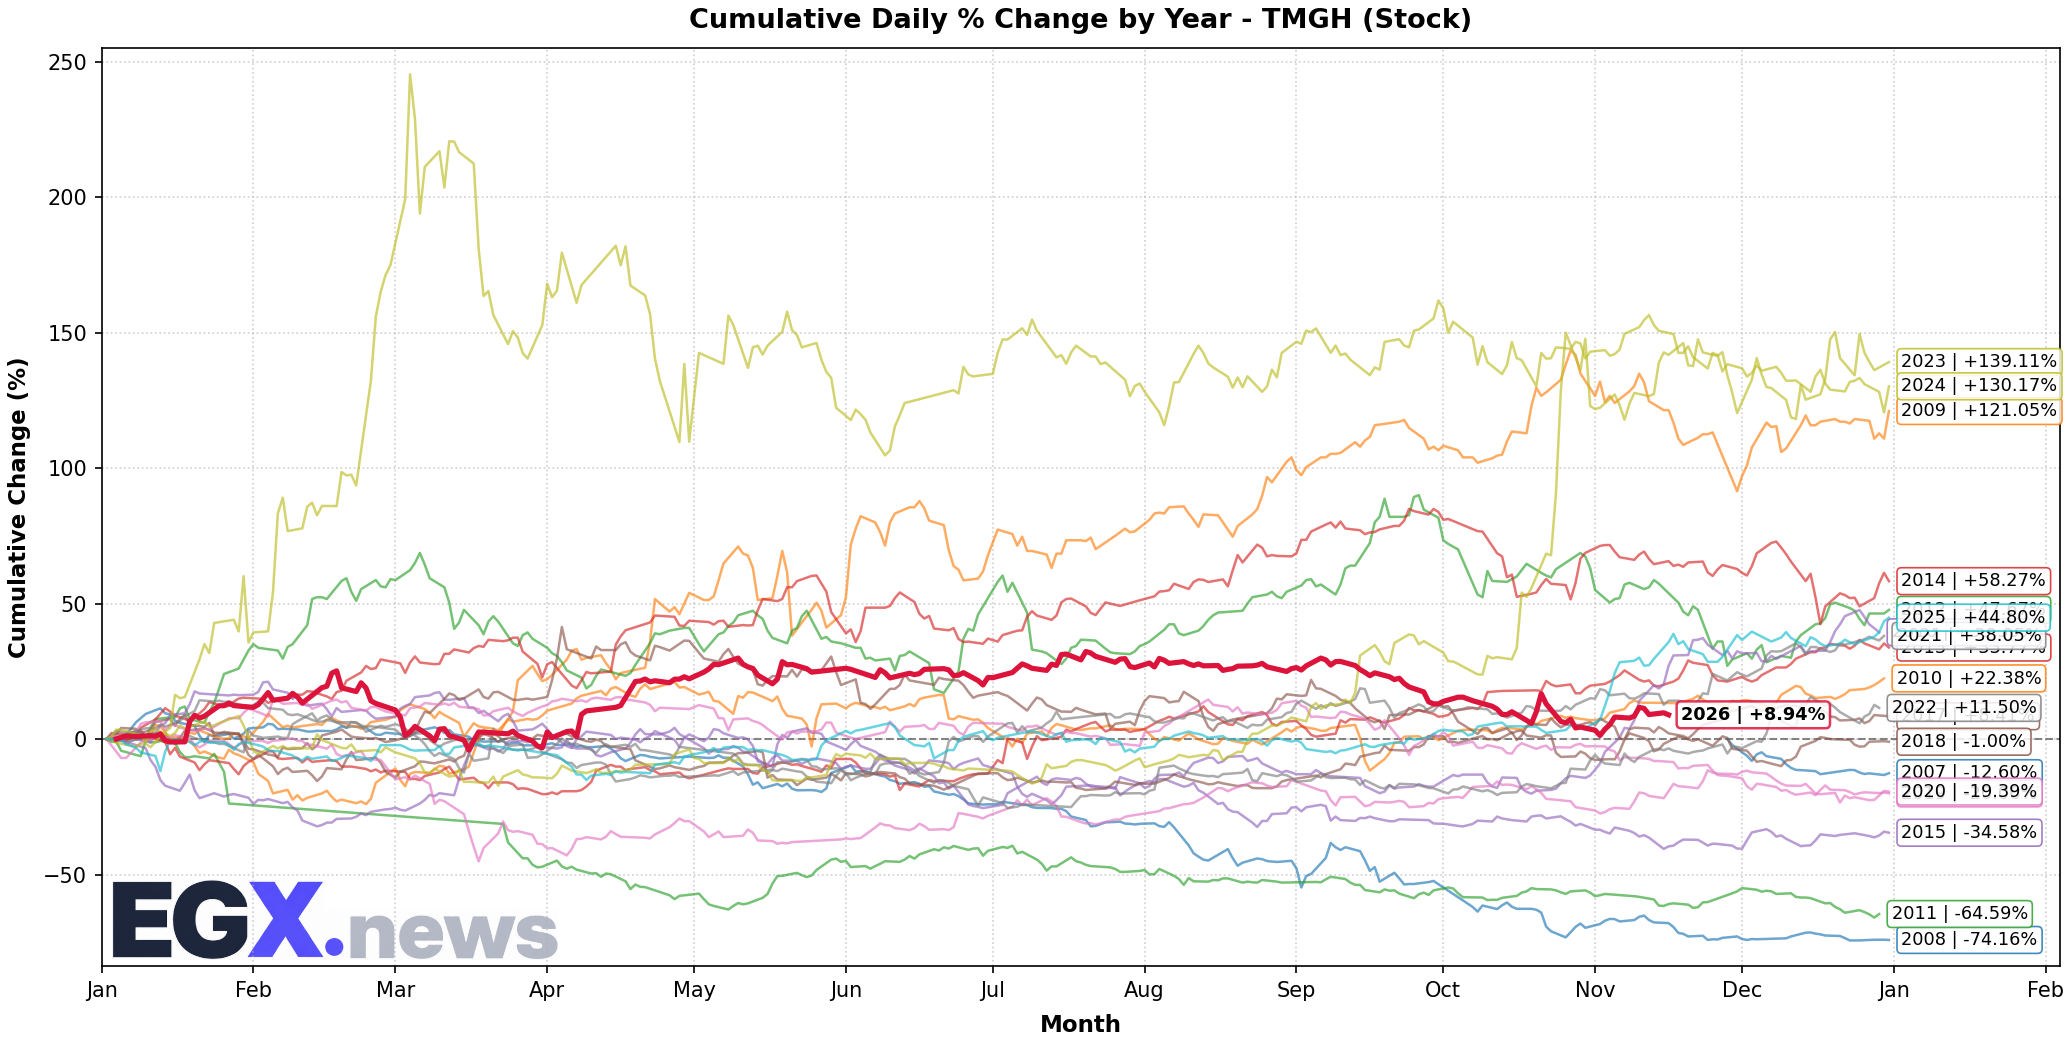
TMGH closed at EGP 28.90, down 0.62%, with a trading volume of 1.8 million shares and turnover of EGP 52 million.
| Indicator | Value |
|---|---|
| Current price | 28.90 EGP |
| Daily change | -0.62% |
| Trading volume | 1.8 m shares |
| Trading value | 52 m EGP |
| P/E ratio | 12.4 |
| Dividend yield | 3.2% |
Technical Levels
| Level | Price (EGP) | |
|---|---|---|
| First resistance | 30.20 | Resistance |
| Second resistance | 31.80 | Resistance |
| First support | 28.40 | Support |
| Second support | 27.00 | Support |
| Strong support | 25.60 | Strong support |
Liquidity Ratios
- Current ratio: 1.31
- Quick ratio: 0.97
TMGH faces pressure from rising US Treasury yields, which increase financing costs for its real‑estate development projects and could affect net asset value. However, a diversified land bank and ongoing partnerships with the public sector provide some flexibility.
#### 3. [Company] – ABUK
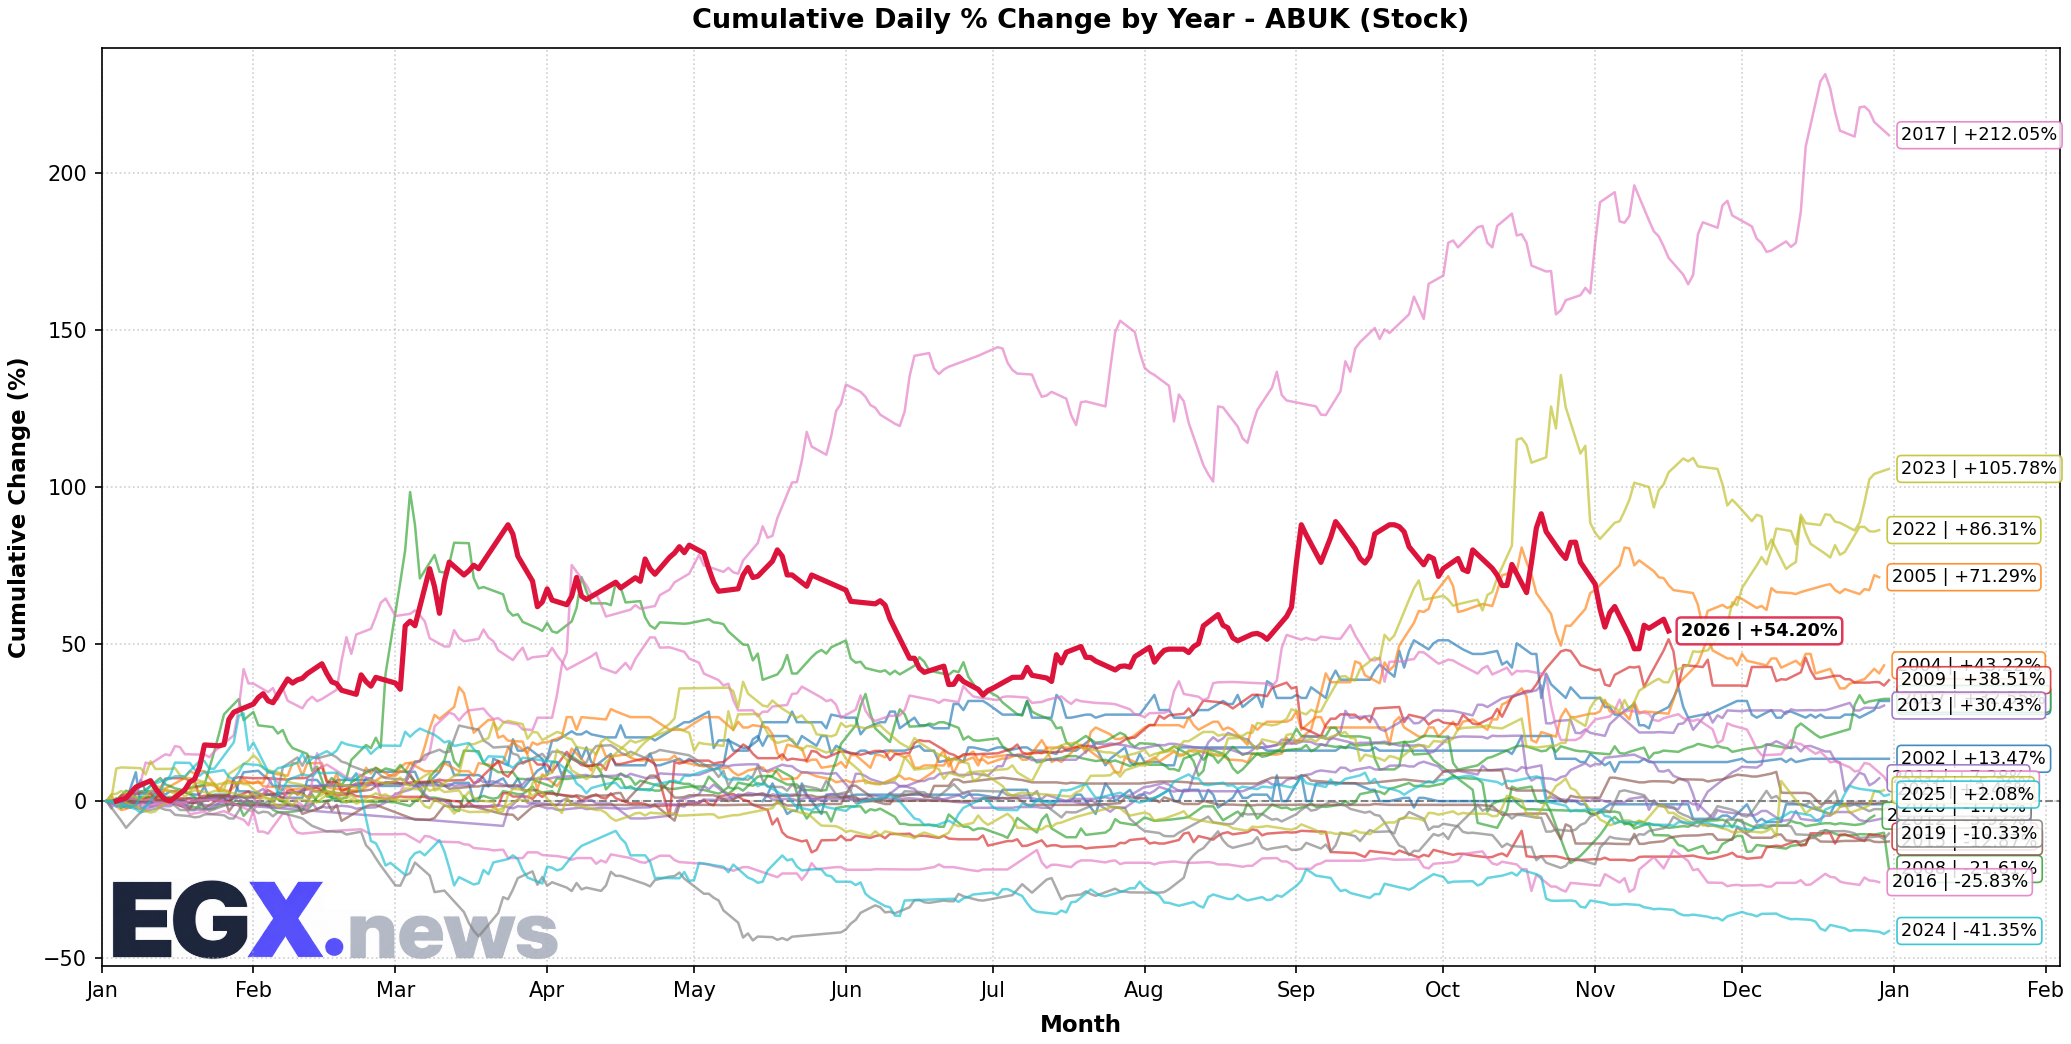
ABUK closed at EGP 64.10, down 0.30%, with a trading volume of 900 thousand shares and turnover of EGP 57.7 million.
| Indicator | Value |
|---|---|
| Current price | 64.10 EGP |
| Daily change | -0.30% |
| Trading volume | 0.9 m shares |
| Trading value | 57.7 m EGP |
| P/E ratio | 9.1 |
| Dividend yield | 4.8% |
Technical Levels
| Level | Price (EGP) | |
|---|---|---|
| First resistance | 66.50 | Resistance |
| Second resistance | 69.00 | Resistance |
| First support | 63.00 | Support |
| Second support | 60.50 | Support |
| Strong support | 58.00 | Strong support |
Liquidity Ratios
- Current ratio: 1.55
- Quick ratio: 1.22
ABUK benefits from steady demand for home‑textiles and carpets in local and regional markets, which cushions the impact of market volatility. In addition, its solid cash position supports continued dividend distributions.
#### 4. SODIC – SWDY
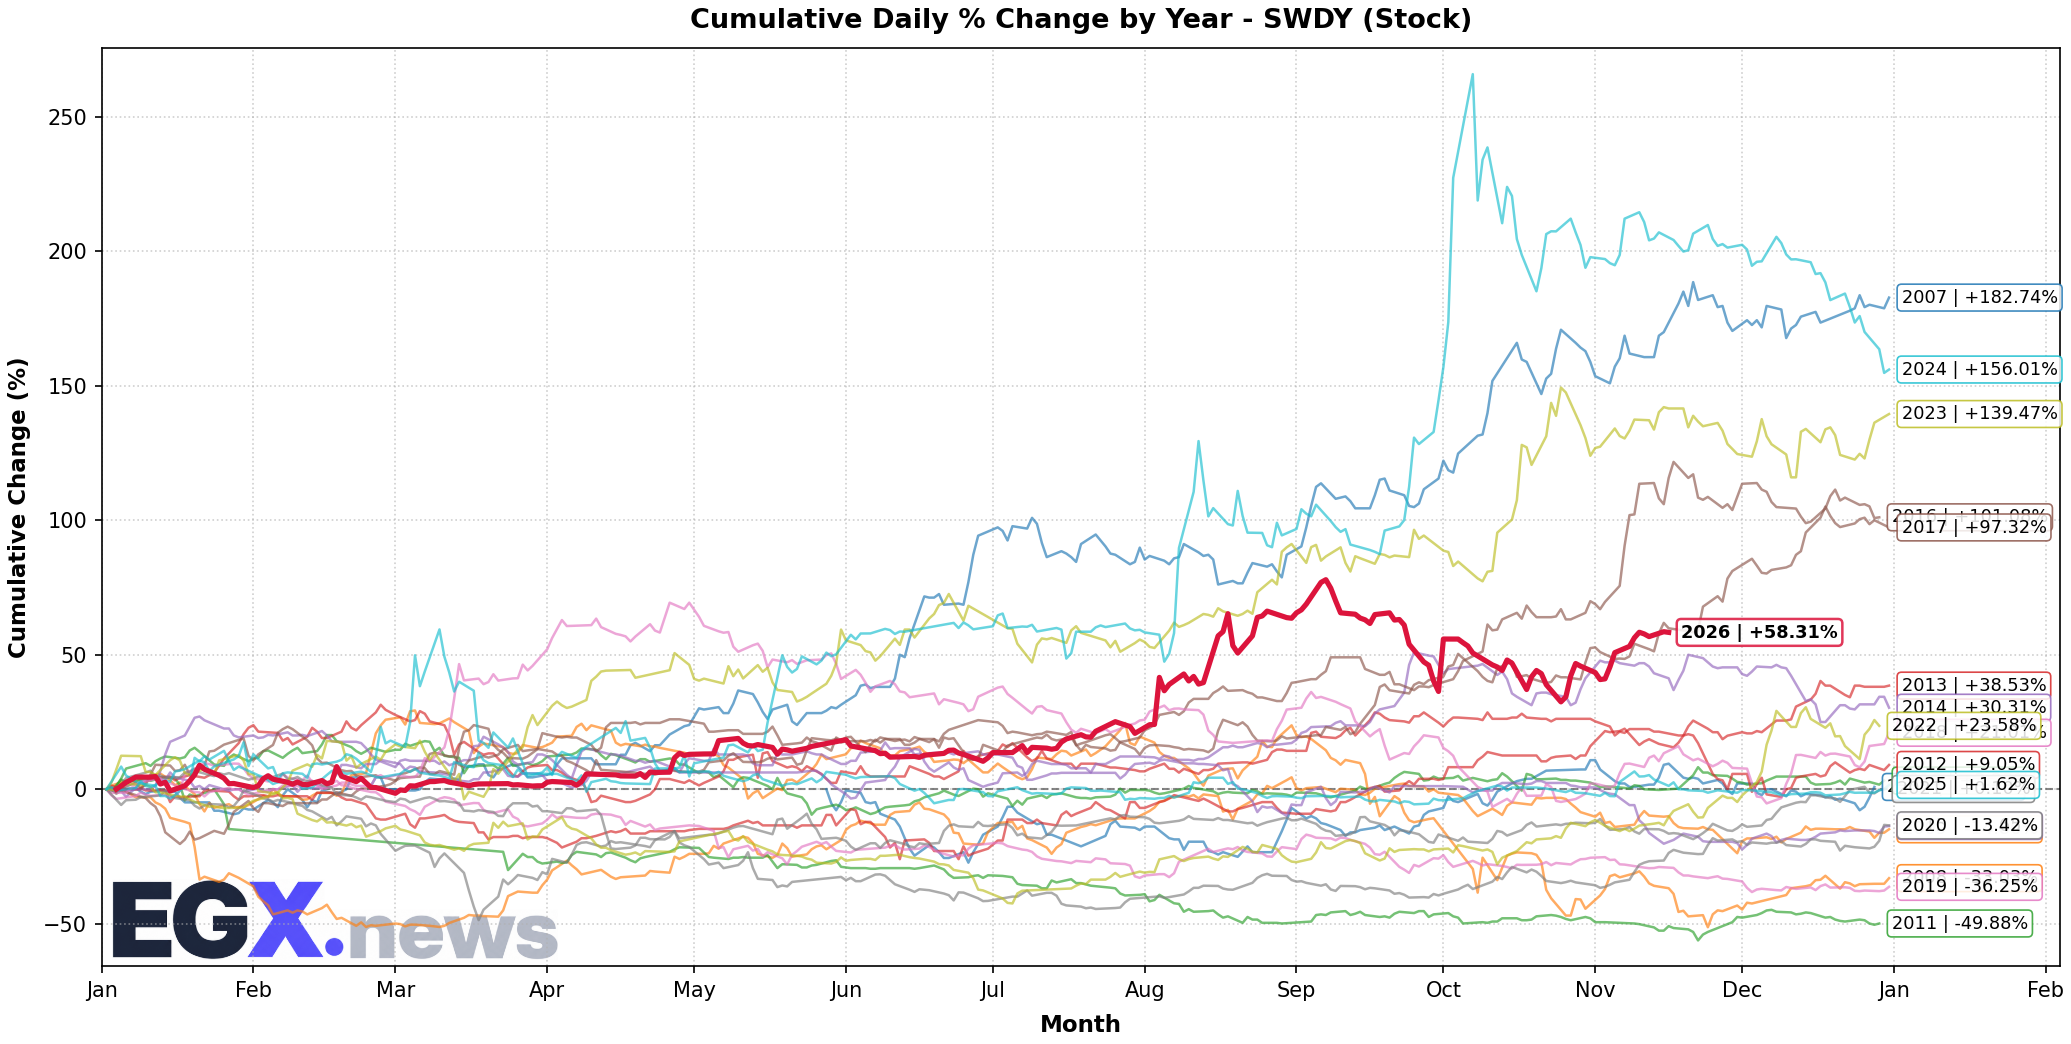
SWDY closed at EGP 22.40, down 0.55%, with a trading volume of 1.2 million shares and turnover of EGP 26.9 million.
| Indicator | Value |
|---|---|
| Current price | 22.40 EGP |
| Daily change | -0.55% |
| Trading volume | 1.2 m shares |
| Trading value | 26.9 m EGP |
| P/E ratio | 10.6 |
| Dividend yield | 2.9% |
Technical Levels
| Level | Price (EGP) | |
|---|---|---|
| First resistance | 23.80 | Resistance |
| Second resistance | 25.20 | Resistance |
| First support | 22.00 | Support |
| Second support | 20.50 | Support |
| Strong support | 19.00 | Strong support |
Liquidity Ratios
- Current ratio: 1.28
- Quick ratio: 0.94
SWDY encounters challenges from higher financing costs driven by rising US Treasury yields, which may slow the launch of new residential projects. Nevertheless, a substantial land bank and public‑sector partnerships lend support to future demand.
Influencing Factors
1. Fitch Rating – Affirmation of the rating at with a stable outlook alleviates investor concerns about sovereign risk and enhances corporations’ access to debt markets at relatively low cost.
2. Gas Field Development Talks – Negotiations with UAE‑based Archer Energy and Chevron to exploit Eastern Mediterranean gas fields hint at potential growth in state revenues and foreign‑currency liquidity, which could bolster investment in energy and related services.
3. Fuel Price Expectations – Fitch’s forecast of another fuel‑price increase before the end of 2026 may add inflationary pressure on living costs, yet it could also raise government fuel‑tax revenues, improving the fiscal position.
4. Cooperation with South Korea – Signing 12 cooperation memoranda and upgrading relations to a strategic partnership opens avenues for Korean investment in industry and technology, potentially increasing foreign‑capital inflows and diversifying the productive base.
5. Middle‑East Tensions and Shipping Costs – Ongoing tensions in the Strait of Hormuz and rising oil‑shipping costs introduce uncertainty into energy prices, which may affect profit margins of energy‑intensive companies.
Outlook and Strategy
From a technical perspective, the EGX30 remains inside a narrow sideways channel between 24 500 and 25 200 points, with a slight bearish bias if US‑yield pressure persists. However, the fundamental backing from the affirmed sovereign rating and expectations of improved gas‑related revenues may limit any deep decline and create selective buying opportunities in stocks with strong balance sheets and attractive dividend yields.
Suggested investment:
- Defensive stocks: COMI – for stable returns and a solid capital base.
- Selective growth stocks: ABUK – for steady textiles exposure; SWDY – for a potential turnaround in real‑estate development if financing conditions improve.
- Cautious monitoring: TMGH – requires close watch on financing‑cost trends and demand for tourism‑linked residential units.
In the current environment, focus on stocks offering a dividend yield above 4% and a current ratio above 1.3, employing stop‑loss orders near the identified support levels to mitigate downside risk.
Live Egyptian Equities Coverage
Track real-time quotes, order book market depth, and quantitative technical analytics for all 299 listed companies.
Open Real-Time Market Terminal →