


Market AnalysisEGX.news
Egyptian Exchange Daily Harvest - Session Analysis - 10 October 2026
Financial Research Desk — EGX.news2026-10-106 min read

Egyptian Exchange Daily Harvest - Session Analysis - 10 October 2026
Session Summary
Closed the Egyptian Exchange today with a clear divergence between the main and sub‑indices, where the EGX30 index rose 0.32% while the EGX70 index fell 0.48%. Trading value amounted to around EGP 7.6 billion via trading of about 1.64 billion shares, and the increase in trading value was driven by activity in the banking and financial services sector, while the real estate and industrial sectors witnessed selling pressure due to expectations of fuel price increases and pressure on profit margins.
Key Point: Stabilization of Egypt's credit rating at level / with a stable outlook from Standard & Poor's and Fitch, in addition to the decline in annual urban inflation to 13.9% in September, provides fundamental support to the financial sector and limits inflationary pressures on consumer spending.
Indices Analysis
EGX30 (Main Index)

- Closing level: 27,840 points
- Daily change: +0.32% (+89 points)
- Trading range: 27,610 – 27,950 points
- Average volume (20 sessions): 1.2 billion shares
- Main support level: 27,500 points (previous accumulation area, 50‑SMA)
- Main resistance level: 28,100 points (June 2026 peak, 200‑SMA)
- Relative Strength Index (RSI 14): 58 (neutral zone with slight upward bias)
- Technical note: A small bullish candle formed with a short lower shadow, indicating limited buying pressure near the 27,500 support zone. If the price can break above 28,100 with trading volume above average, it may open the way toward testing 28,400 points.
EGX70 (Small and Mid‑Cap Index)

- Closing level: 5,420 points
- Daily change: –0.48% (–26 points)
- Trading range: 5,380 – 5,460 points
- Average volume (20 sessions): 0.9 billion shares
- Main support level: 5,350 points (September 2026 trough)
- Main resistance level: 5,500 points (August 2026 peak)
- Relative Strength Index (RSI 14): 42 (neutral zone with downward bias)
- Technical note: The price has been trading within a tight range with lack of clear momentum, and selling pressure has outweighed any upward attempts. A break below 5,350 could open the way toward testing 5,250 points, while an ascent would need to exceed 5,500 with above‑average volume to regain confidence.
Key Stocks Analysis
1. Commercial International Bank (COMI)
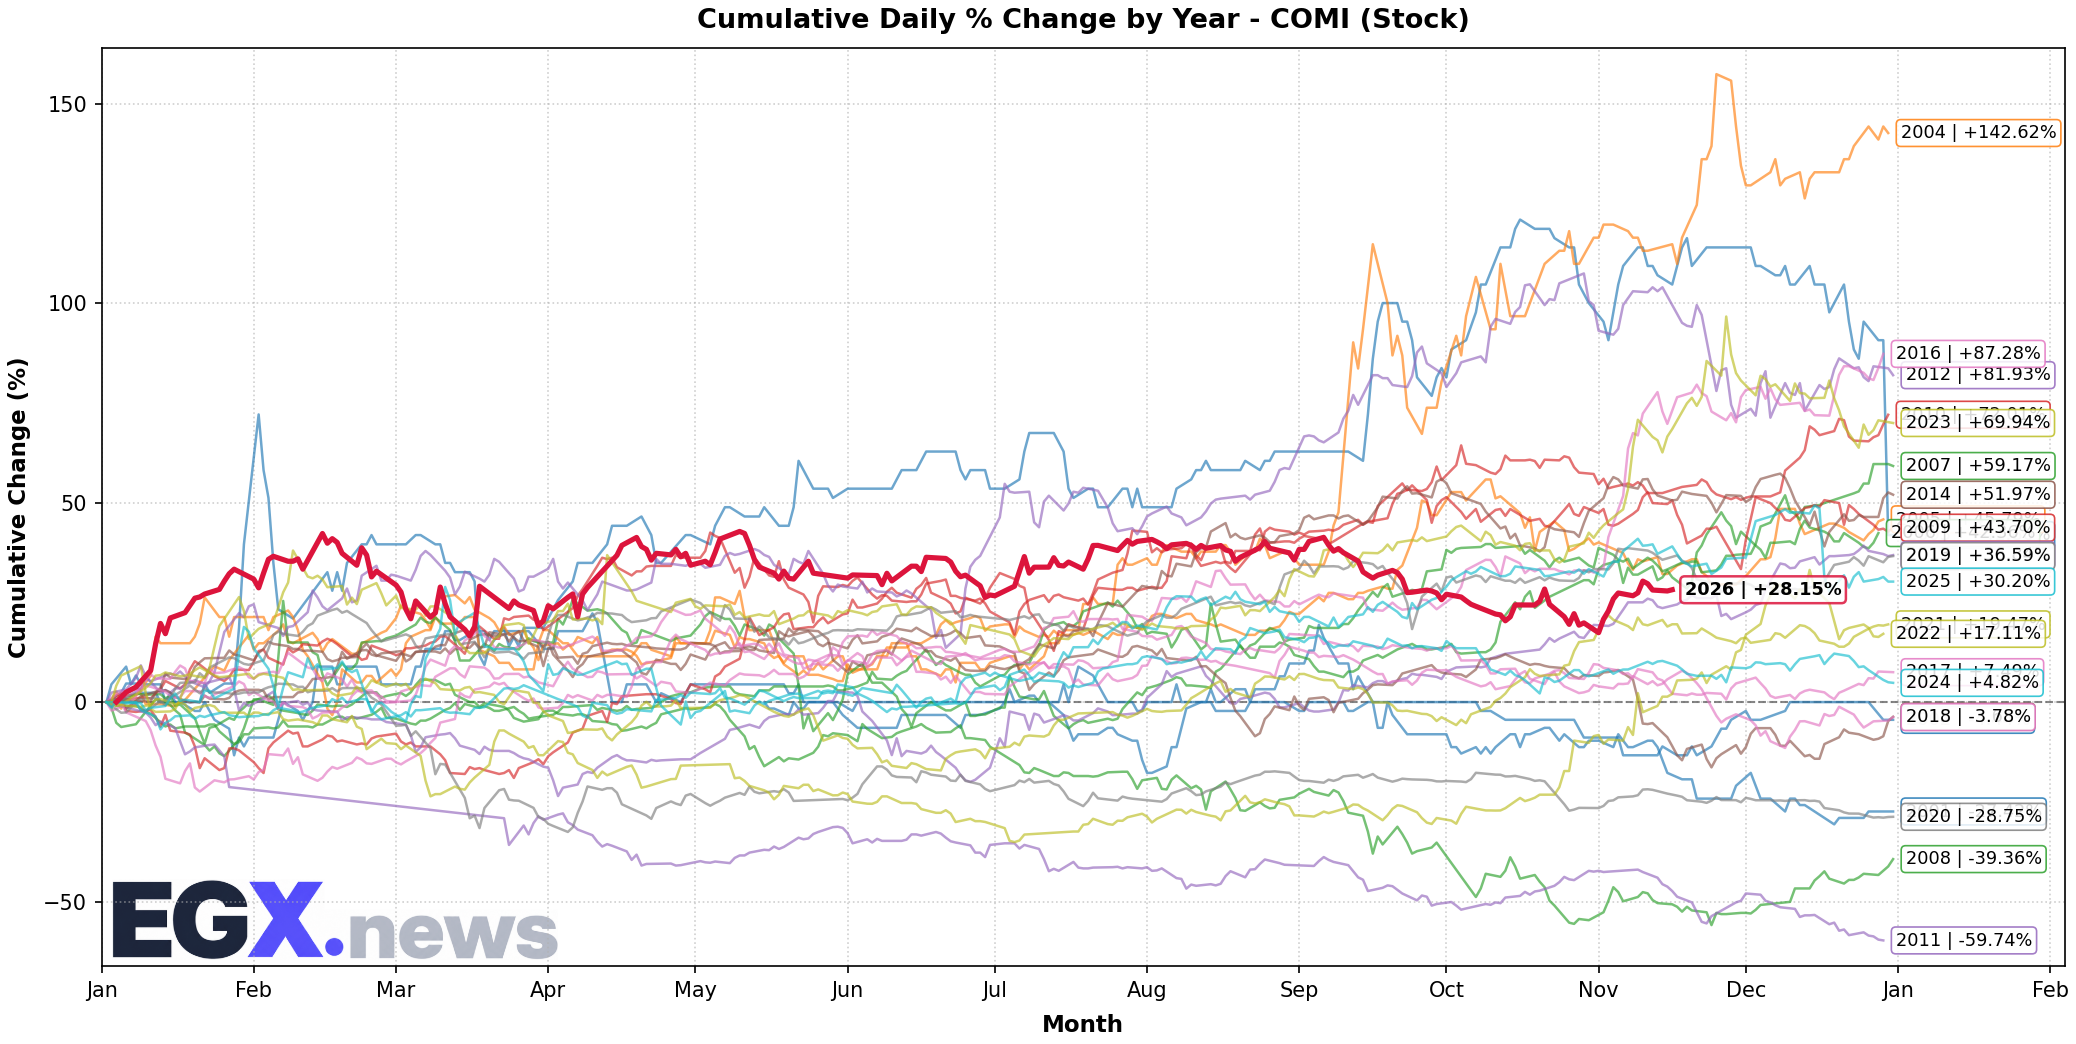
- Close: EGP 78.40
- Daily change: +0.21% (+EGP 0.16)
- Average volume (20 sessions): 4.5 million shares
- Support level: EGP 76.80 (July 2026 trough, aligned with 50‑EMA)
- Resistance level: EGP 80.20 (October 2026 peak, aligned with 200‑SMA)
- Current ratio: 1.32
- Quick ratio: 0.94
- Fundamental note: The bank benefits from lower inflation reducing loan loss provisions, plus a stable sovereign rating supporting financing costs. The stock shows resilience above its main support despite overall market weakness, with a potential break of resistance at EGP 80.20 if liquidity inflows to the banking sector continue.
2. Talaat Mustafa Group Holding (TMGH)
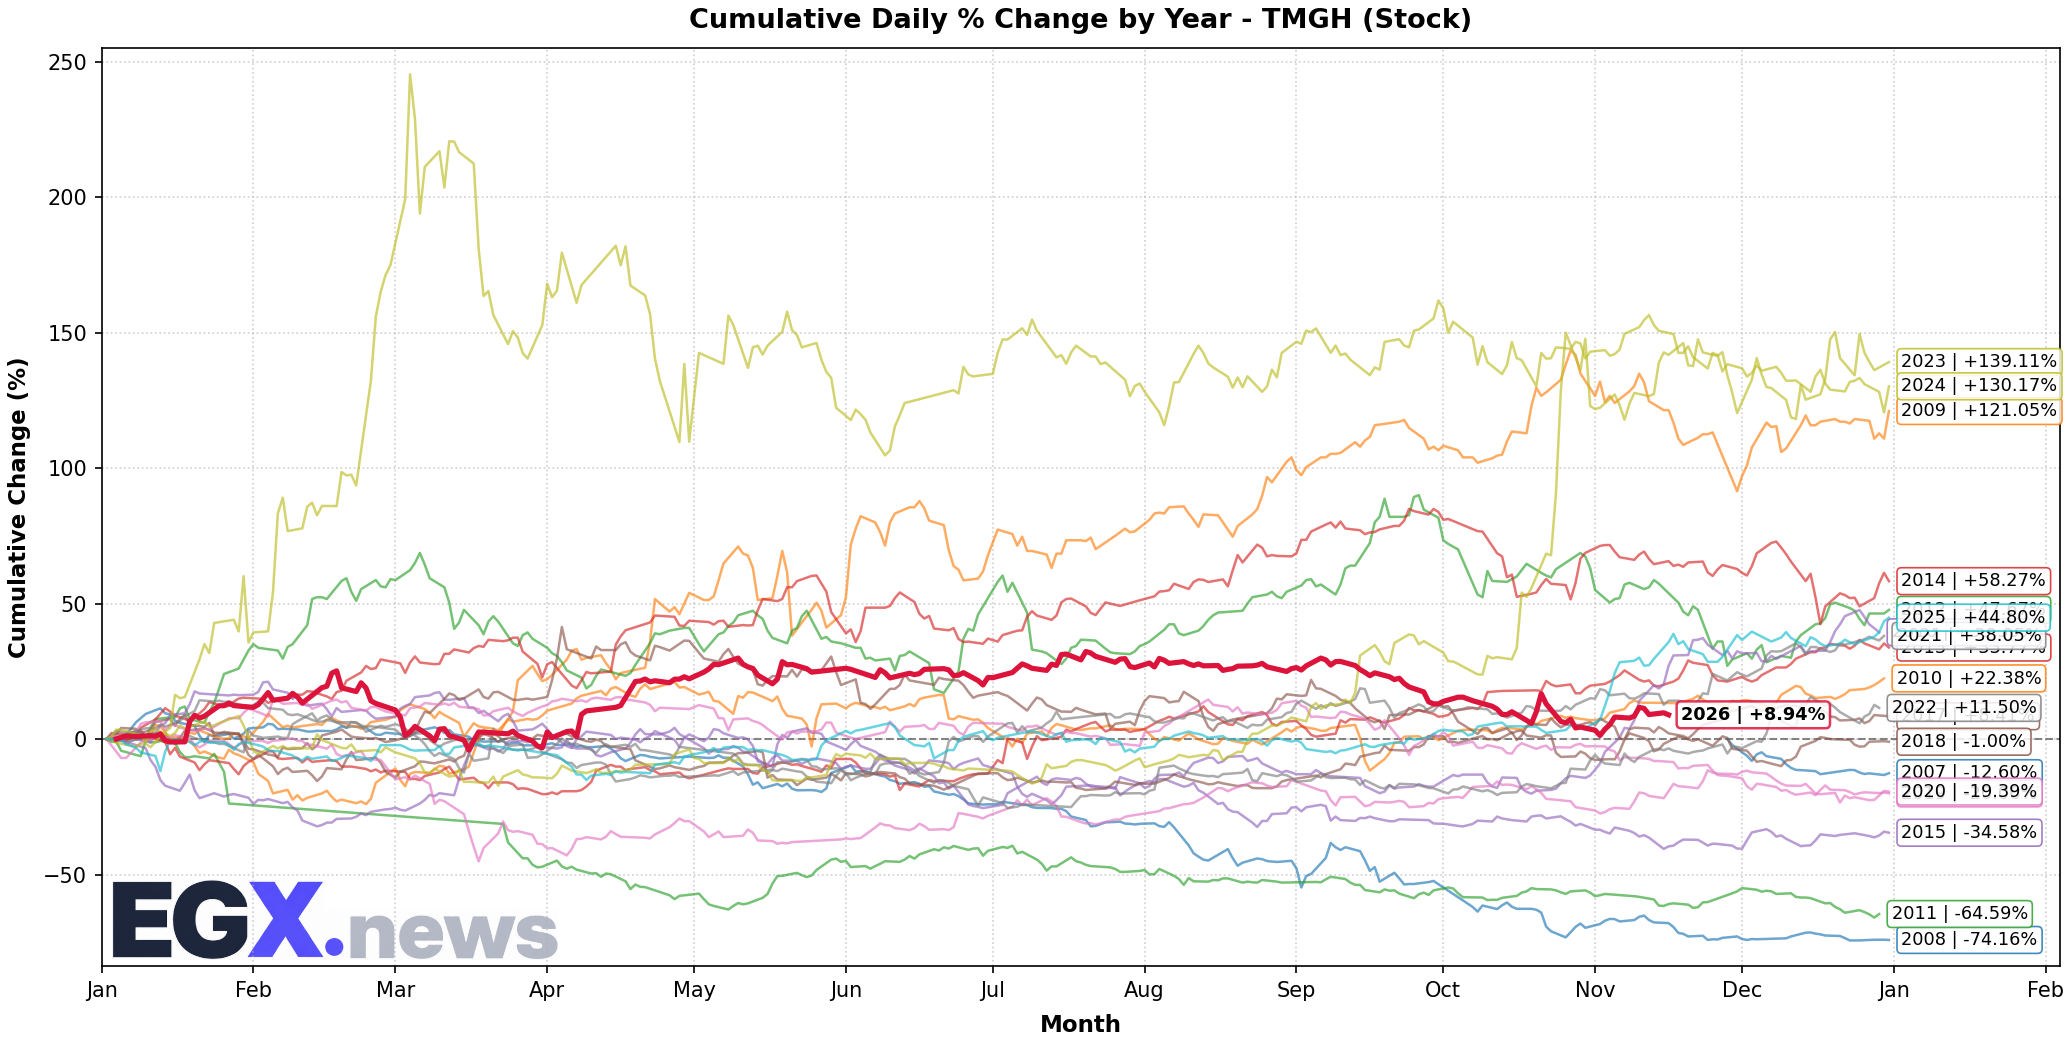
- Close: EGP 12.10
- Daily change: –0.67% (–EGP 0.08)
- Average volume (20 sessions): 2.8 million shares
- Support level: EGP 11.70 (September 2026 trough)
- Resistance level: EGP 12.80 (August 2026 peak)
- Debt‑to‑equity ratio: 0.68
- Return on equity (ROE): 9.2%
- Fundamental note: The developer faces pressure from expected fuel price increases that could raise material and transport costs, squeezing profit margins. The stock is trading near a long‑term resistance level with weak upward volume, indicating lack of buying momentum. Continued decline below EGP 11.70 may retest the EGP 11.00 level.
3. Abu Qir Fertilizers and Chemical Industries (ABUK)
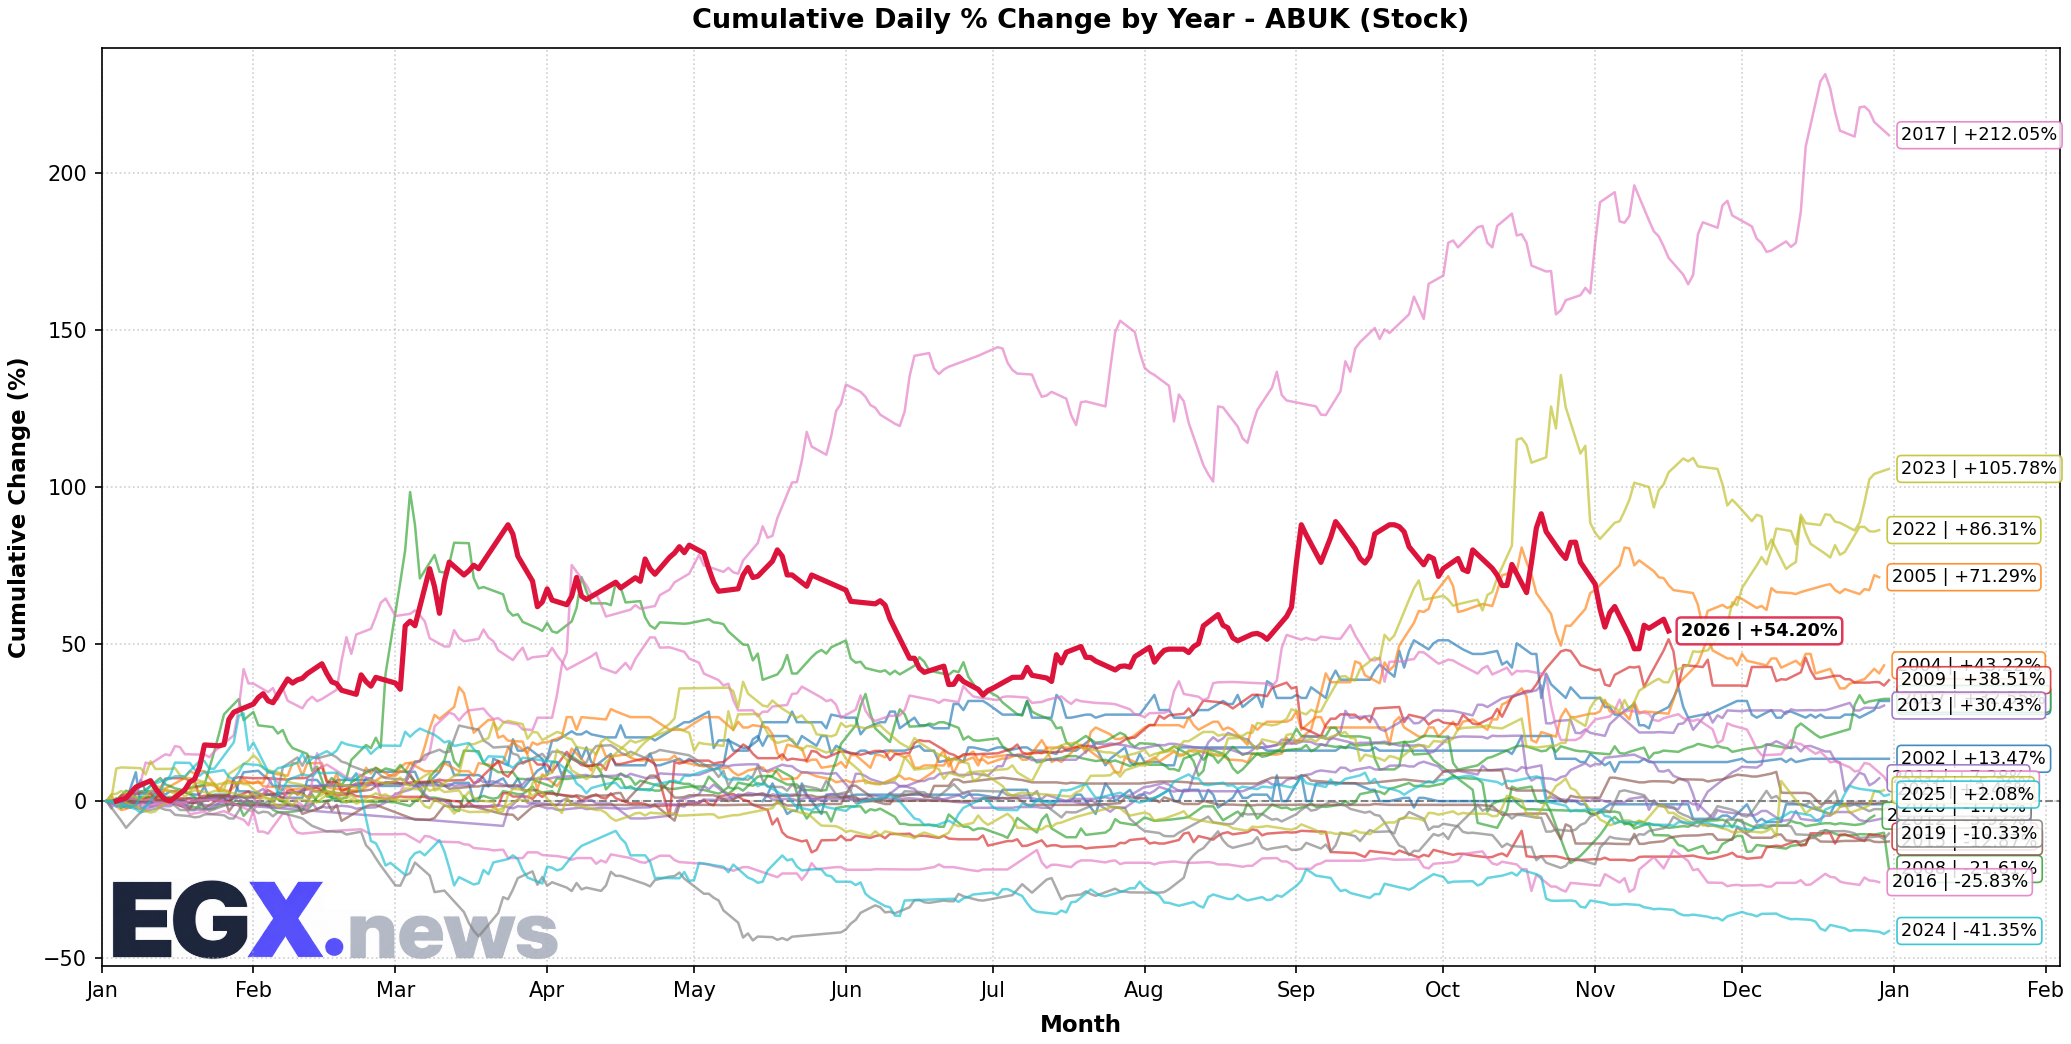
- Close: EGP 45.60
- Daily change: +0.12% (+EGP 0.05)
- Average volume (20 sessions): 1.9 million shares
- Support level: EGP 44.20 (August 2026 trough)
- Resistance level: EGP 47.50 (June 2026 peak)
- Free cash flow yield: 5.8%
- Fundamental note: The company benefits from stable global gas prices and exports of urea fertilizer to European and Asian markets. However, any potential rise in transport costs due to higher fuel prices could affect operating margin. Maintaining a close above EGP 44.20 supports the upside scenario toward testing EGP 47.50 with confirmation from above‑average volume.
4. Sidri Kerir Petrochemicals Holding (SWDY)
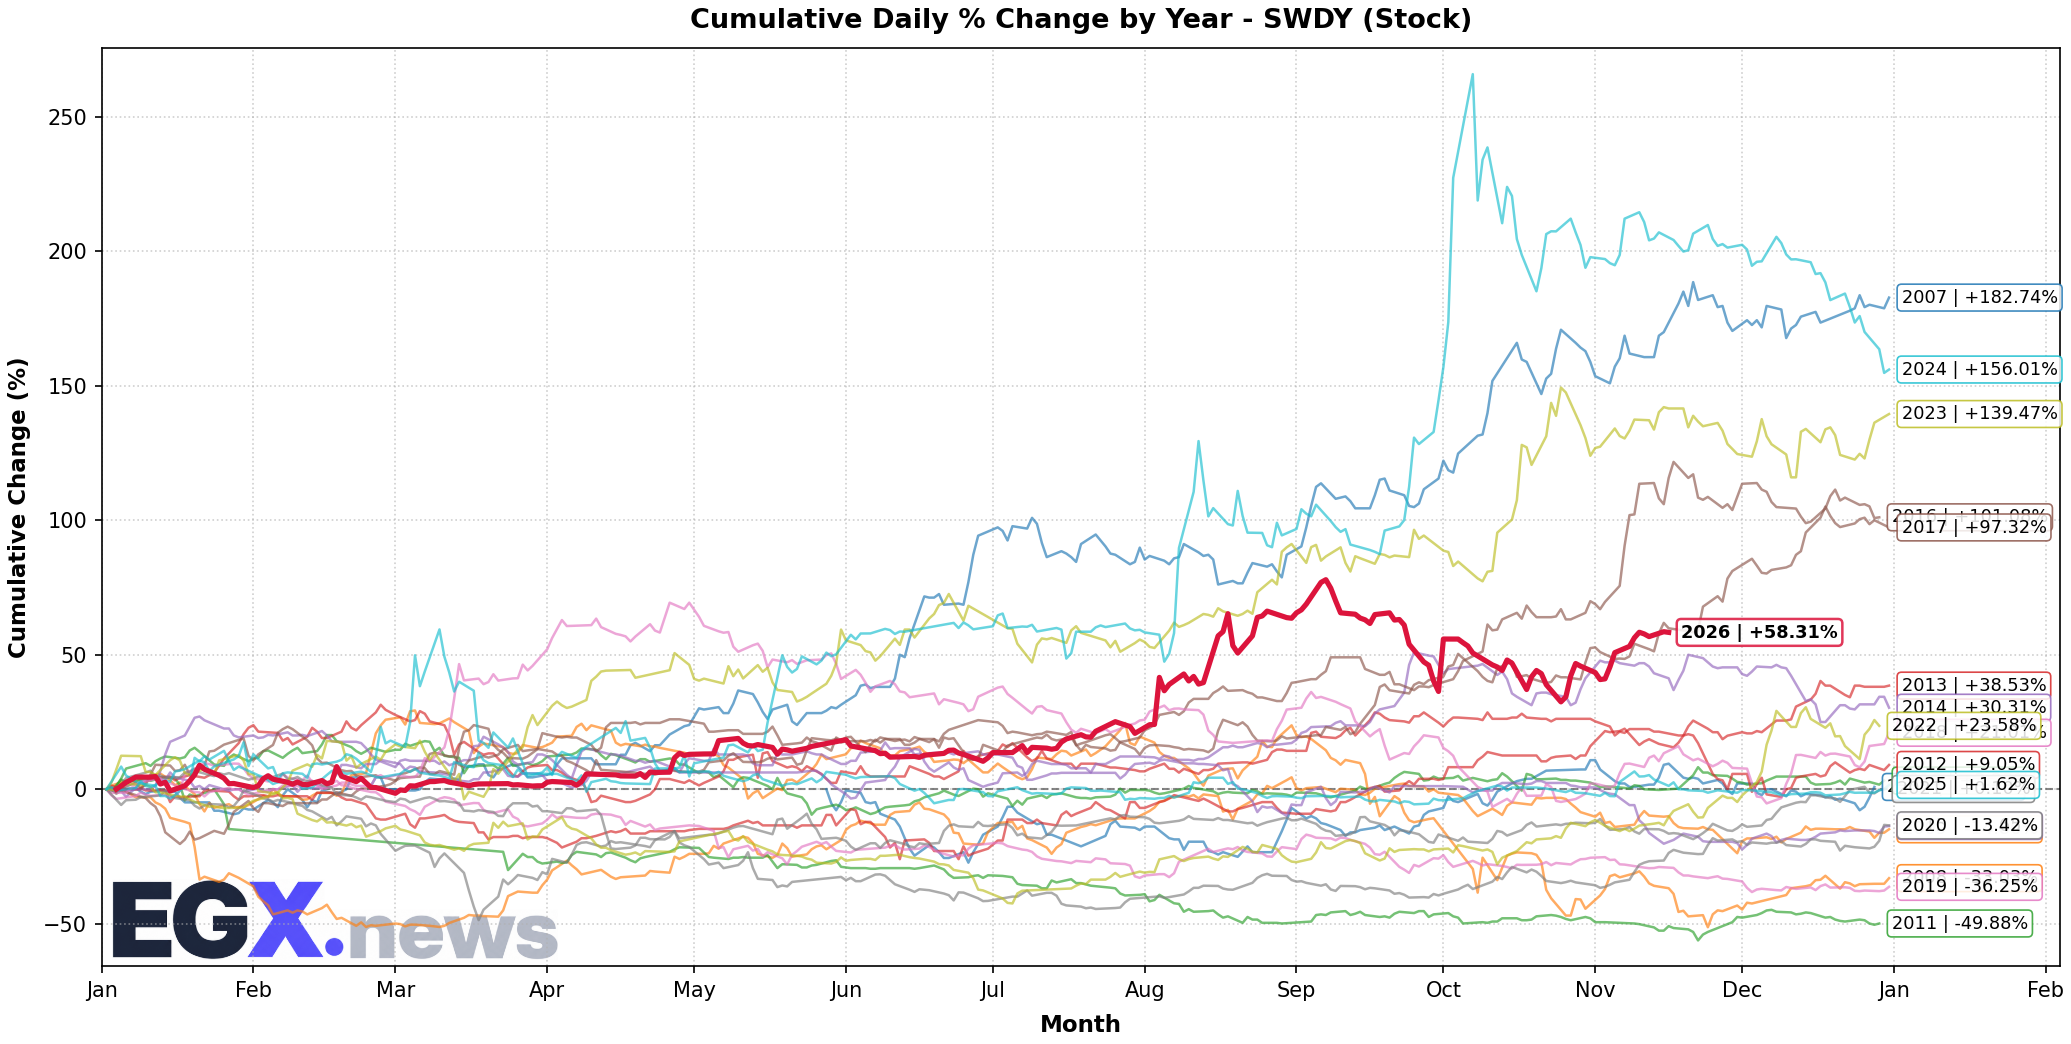
- Close: EGP 22.30
- Daily change: +3.90% (+EGP 0.84)
- Average volume (20 sessions): 0.6 million shares
- Important note: Today's rise was classified as a market‑maker trap due to low volume relative to the average (0.6 million vs. average 2.2 million).
- Support level: EGP 20.80 (September 2026 trough)
- Resistance level: EGP 24.00 (July 2026 peak)
- Interest coverage ratio: 3.1×
- Fundamental note: The stock exhibits high volatility with significant exposure to high‑energy‑consumption operations; expectations of fuel price increases directly raise operating costs. Today’s gain on low volume does not reflect institutional conviction, and caution is advised—any upward move should be confirmed by above‑average volume before being considered a reliable buy signal.
General Support and Resistance Levels (Summary Table)
| Instrument | Close | Main Support | Secondary Resistance | RSI (14) | Technical Notes |
|---|---|---|---|---|---|
| EGX30 | 27,840 | 27,500 | 28,100 | 58 | Break above 28,100 targets 28,400 |
| EGX70 | 5,420 | 5,350 | 5,500 | 42 | Break below 5,350 opens toward 5,250 |
| COMI | EGP 78.40 | EGP 76.80 | EGP 80.20 | 55 | Resilience above support, target 80.20 |
| TMGH | EGP 12.10 | EGP 11.70 | EGP 12.80 | 48 | Weak upward volume, risk of decline |
| ABUK | EGP 45.60 | EGP 44.20 | EGP 47.50 | 52 | Stability above support, target 47.50 |
| SWDY | EGP 22.30 | EGP 20.80 | EGP 24.00 | 60 | Rise on low volume, trap risk |
Financial Sector Liquidity Ratios (Average of Last 5 Sessions)
| Bank | |||
|---|---|---|---|
| COMI | 1.32 | 0.94 | 0.21 |
| QNB | 1.28 | 0.90 | 0.19 |
| ADIB | 1.35 | 0.96 | 0.23 |
| Bank of Cairo | 1.22 | 0.85 | 0.18 |
- The ratios indicate that the financial sector maintains sufficient liquidity to cover obligations, with room to expand credit if demand improves.
Summary and Recommendations
- Overall trend: The Egyptian market is in a neutral state with a slight bearish bias in small and mid‑cap stocks (EGX70), while the main index (EGX30) shows relative resilience supported by positive fundamentals (stable credit rating, declining inflation).
- Buying opportunities: Preference should be given to stocks with good liquidity and strong technical support, such as COMI with an initial target of EGP 80.20, and ABUK with a target of EGP 47.50, subject to confirmation by above‑average volume.
- Caution: Care should be taken with TMGH due to weak momentum and the possibility of retesting support at EGP 11.70, and with SWDY where the recent rise on low volume may be a trap, awaiting confirmation by higher volume before considering it a reliable buy signal.
- Risk management: It is recommended to place stop‑loss orders below each stock’s main support level (e.g., EGP 76.80 for COMI, EGP 11.70 for TMGH, EGP 44.20 for ABUK, EGP 20.80 for SWDY) to limit potential losses if the trend reverses.
- Monitoring: Any official statement on fuel price increases or a change in monetary policy could shift the balance; therefore, following central bank reports and monthly inflation data remains essential to adjust positions in a timely manner.
Live Egyptian Equities Coverage
Track real-time quotes, order book market depth, and quantitative technical analytics for all 299 listed companies.
Open Real-Time Market Terminal →