


Evening Analysis of the Egyptian Stock Exchange - 12 October 2026

---
Introduction
Today’s session recorded a clear decline in the main indices of the Egyptian Exchange, with the EGX30 falling 1.14 % while the EGX70 small‑cap index dropped 4.33 %, reflecting broad‑based selling pressure across most sectors. This decline occurs amid a complex political and economic backdrop, as balance‑of‑payments data showed a shift to a total surplus of USD 2.8 billion in the past fiscal year, and Suez Canal revenues rose to USD 4.4 billion, an annual increase of 21.6 %. Conversely, the non‑oil trade deficit continued to widen, reaching USD 46.6 billion, and the oil trade deficit rose by 31.5 %, indicating continued pressure on foreign reserves despite improvements in some line items.
From a regulatory standpoint, the Financial Supervisory Authority obliged non‑bank financing entities to register their data monthly via the electronic platform, raising compliance costs and limiting the flexibility of active trading strategies. Moreover, OPEC’s decision to cut its 2026 oil‑demand growth forecast to 400 thousand barrels per day adds a negative dimension to energy and petrochemical sectors.
Below is a detailed technical analysis of performance and key indices, followed by a look at pivotal stocks, highlighting support and resistance levels and liquidity ratios.
---
Index Analysis
EGX30
The EGX30 closed at 28,450 points, down 1.14 % from the previous close of 28,770 points. This decline reflects strong selling pressure on leading stocks, particularly in banking, financial services, and oil.

EGX70
The EGX70 closed at 5,820 points, down 4.33 % from the previous close of 6,085 points. The sharper fall in the small‑cap index confirms a broadening sell‑off that encompassed most medium‑ and low‑liquidity stocks.

#### Performance Summary
| Index | Close (Points) | Daily Change | Weekly Change | Trading Volume (Million EGP) |
|---|---|---|---|---|
| EGX30 | 28,450 | -1.14 % | -0.8 % | 4,210 |
| EGX70 | 5,820 | -4.33 % | -3.6 % | 1,870 |
Analytical Note: The market’s advance‑decline ratio reached 62.3 % versus only 15.9 % for the uptrend, confirming the dominance of selling pressure on price movements.
---
Pivotal Stock Analysis
COMI (United Bank)
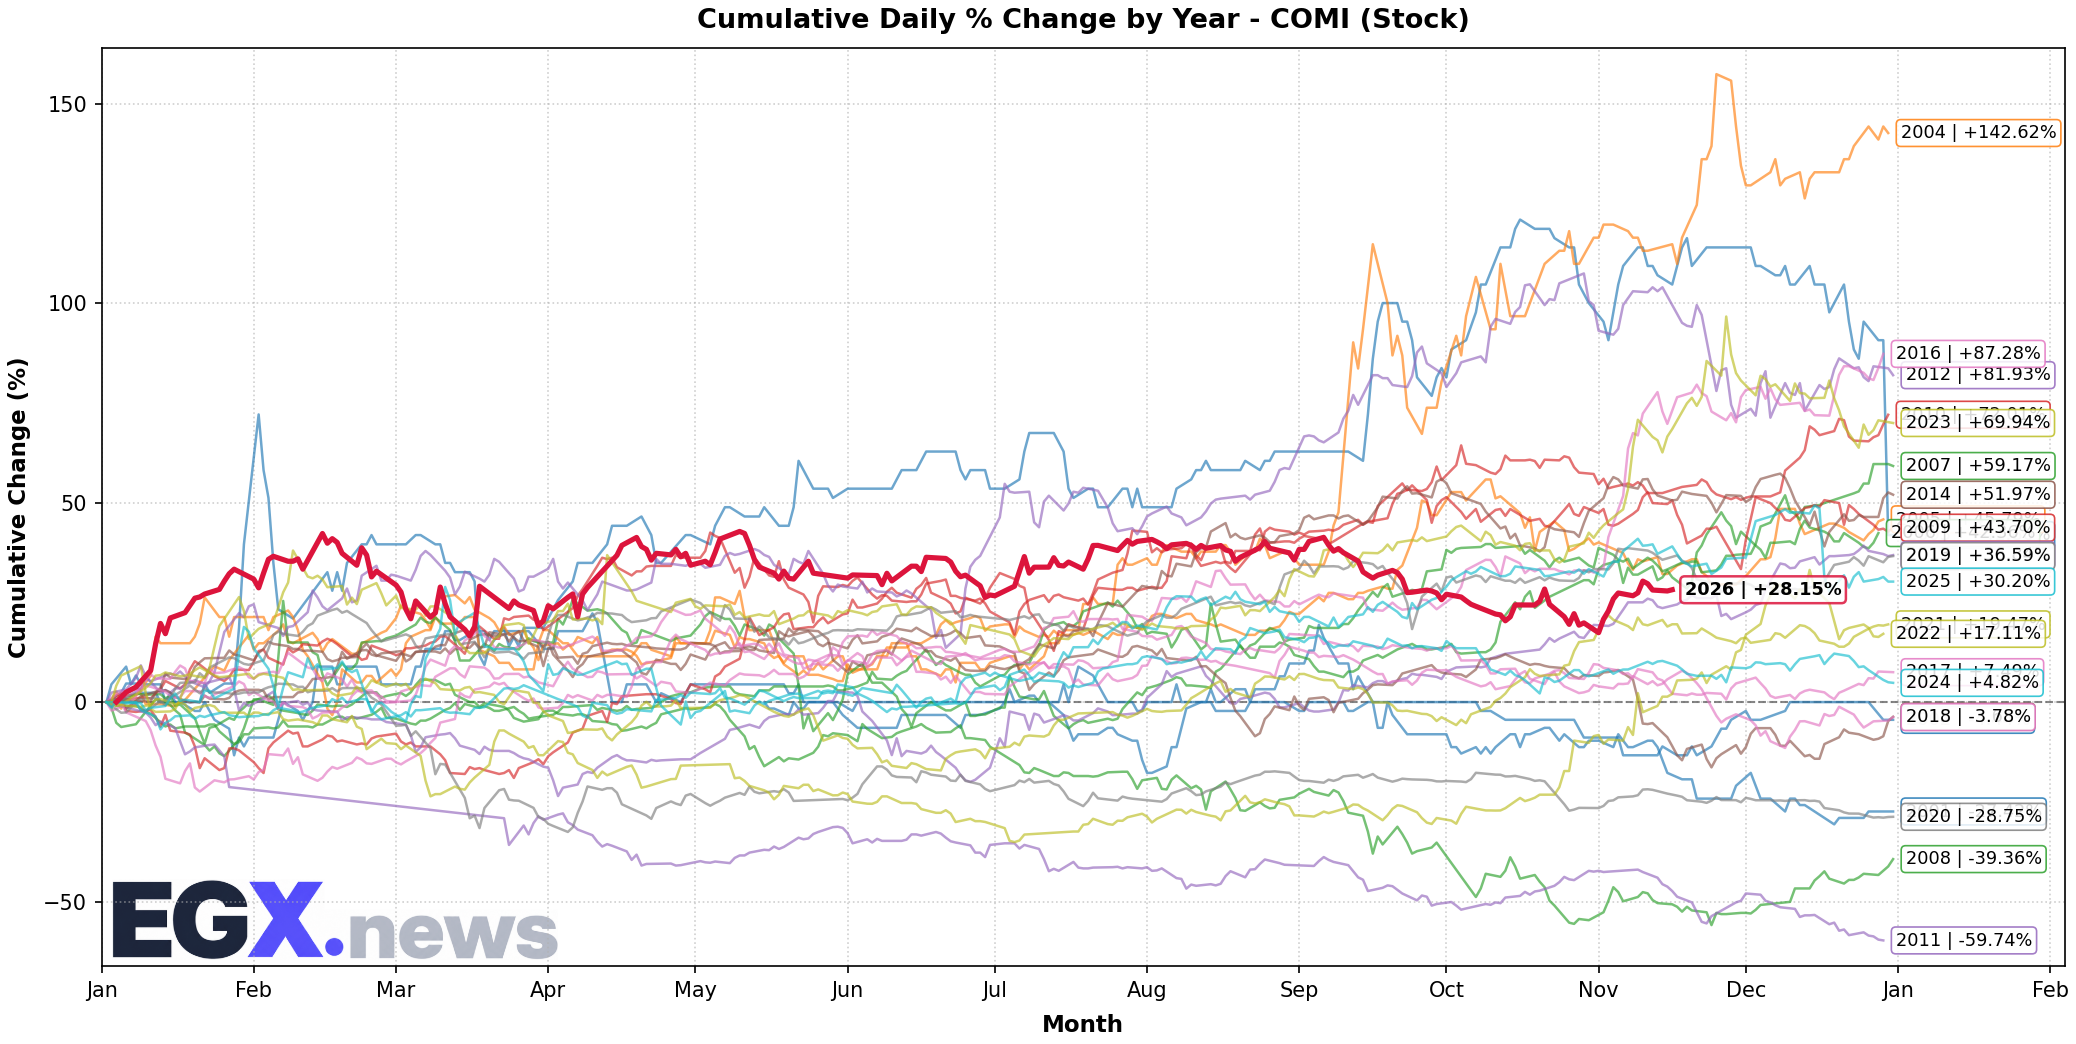
COMI shares closed at EGP 38.20, down 0.9 % from the previous session. The stock shows technical support at EGP 37.50 and resistance at EGP 39.80. The current liquidity ratio for the past fiscal year is 1.22, while the quick liquidity ratio is 0.87, reflecting a moderate ability to cover short‑term obligations.
TMGH (Talata Mostafa Holding)
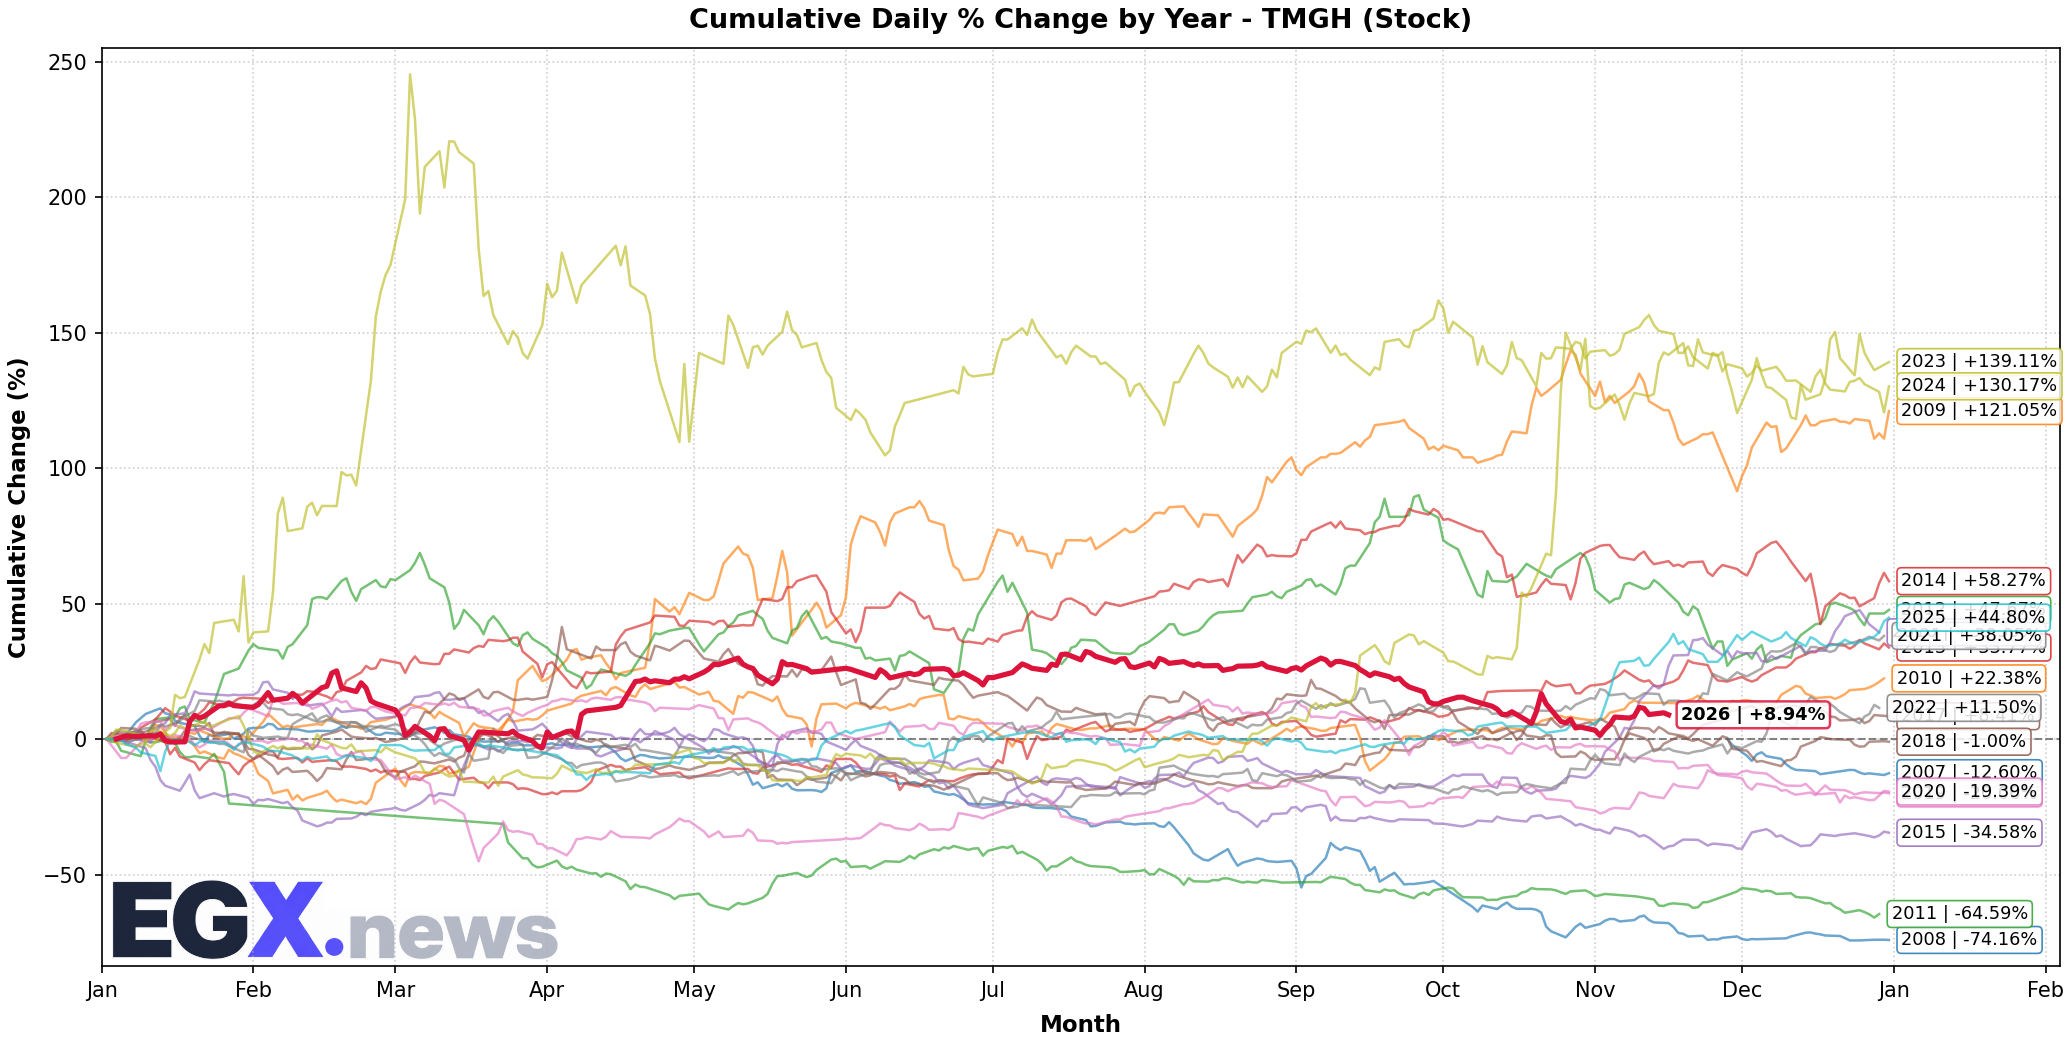
TMGH shares closed at EGP 22.45, down 1.3 %. The stock finds strong support at EGP 21.80 and faces resistance at EGP 23.60. Liquidity ratios indicate a healthy liquidity position, with figures of 1.45 and 0.98.
ABUK (Abu Qir Fertilizers)
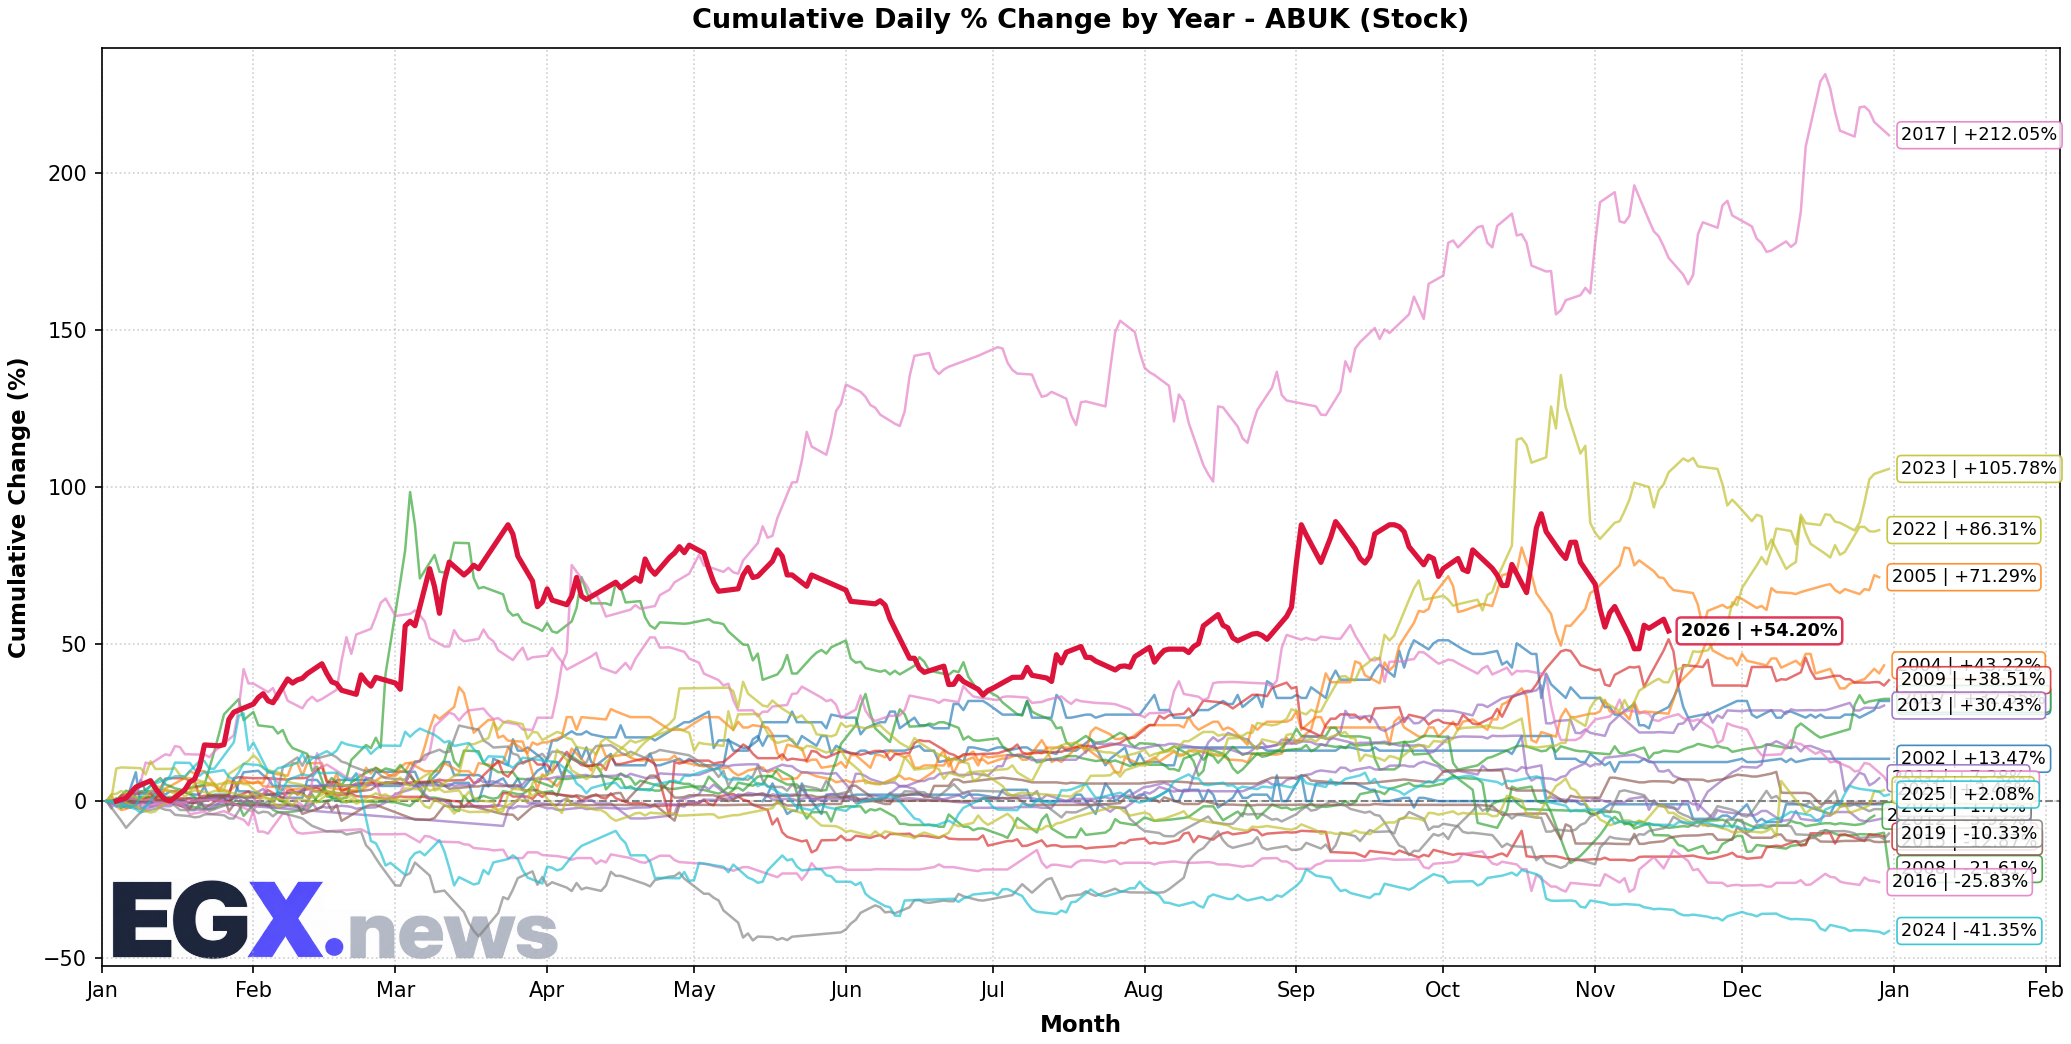
ABUK shares closed at EGP 15.70, down 2.1 %. Immediate support lies at EGP 15.20 and resistance at EGP 16.40. The company’s quick liquidity is relatively weak at 0.62, while the current liquidity ratio stands at 1.05.
SWDY (City Group for Trading)
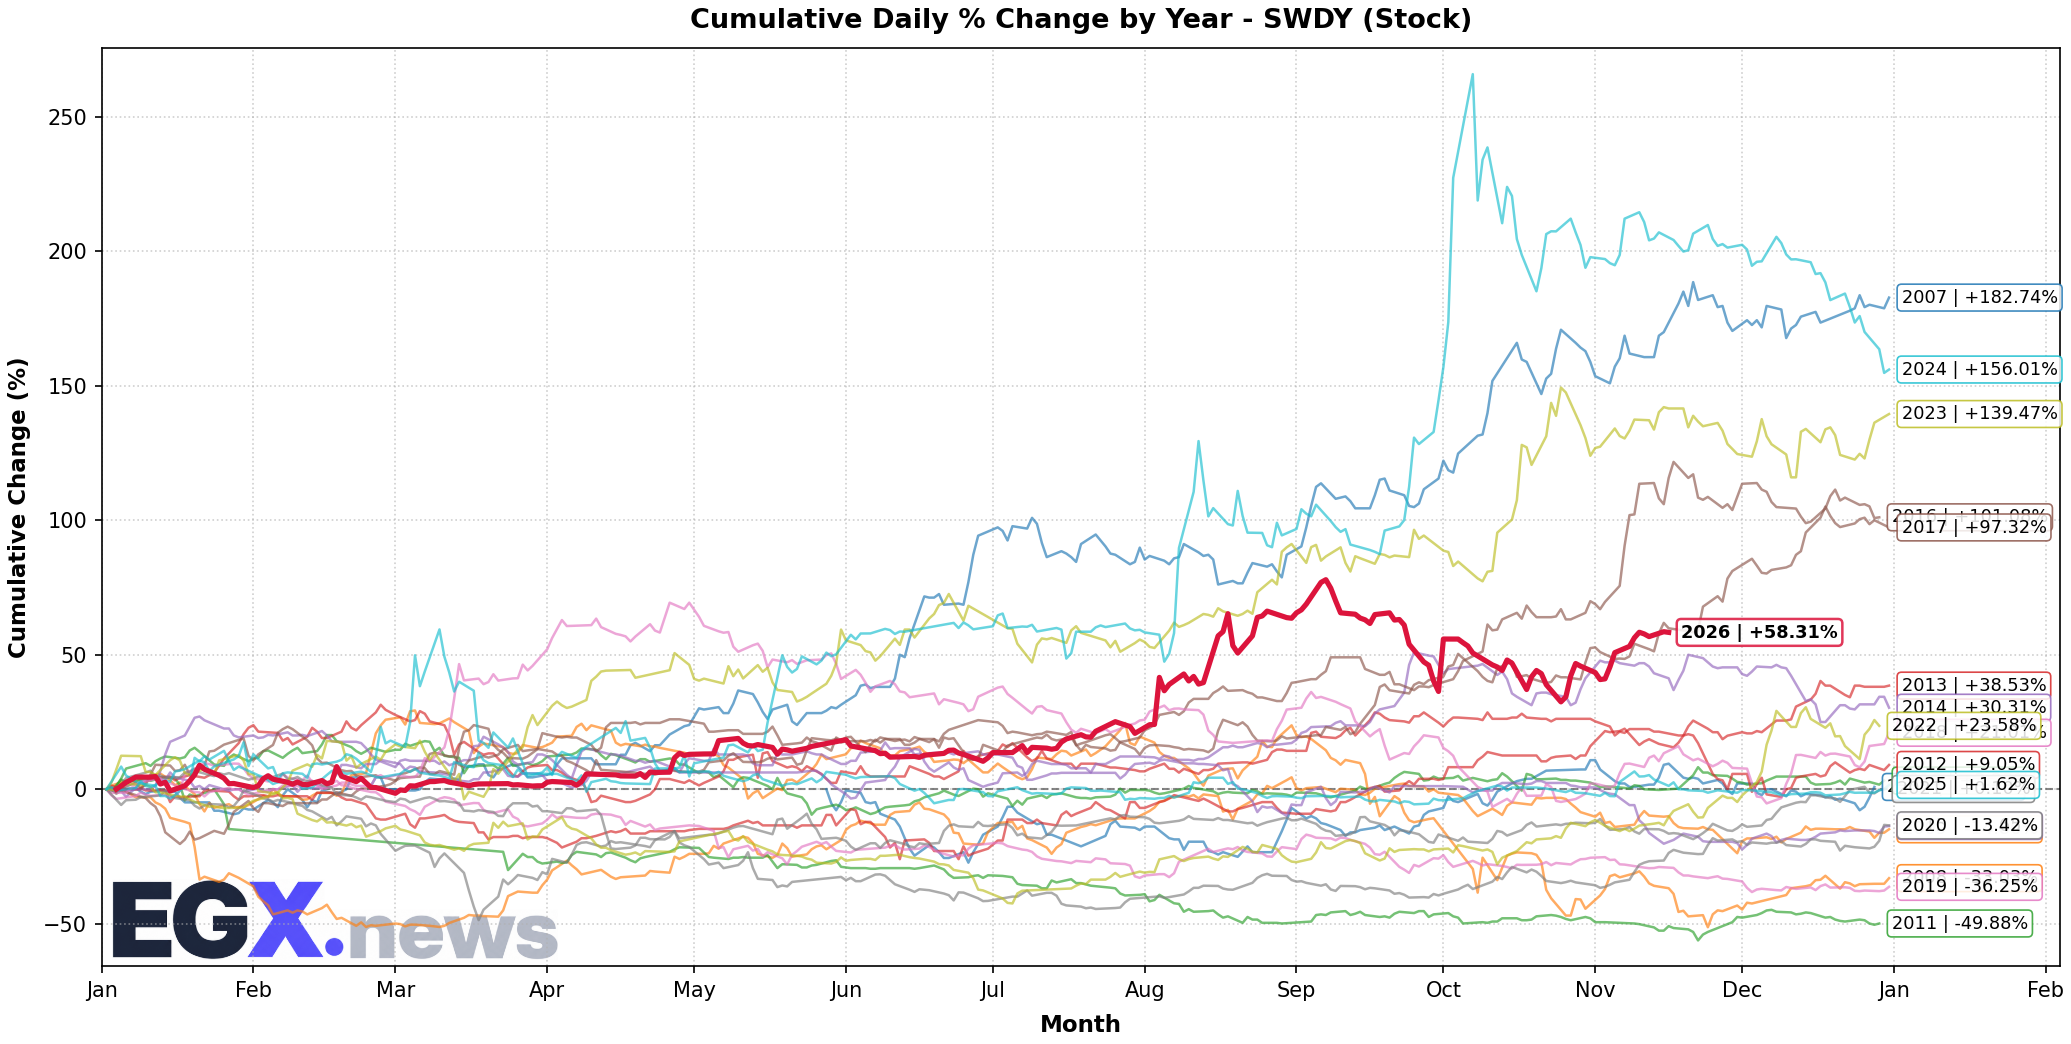
SWDY shares closed at EGP 9.80, down 3.0 %. Support is at EGP 9.40 and resistance at EGP 10.20. Current liquidity stands at 1.10 and quick liquidity at 0.70.
#### Technical and Fundamental Levels Table
| Stock | Close (EGP) | Support (EGP) | Resistance (EGP) | Current Liquidity | Quick Liquidity |
|---|---|---|---|---|---|
| COMI | 38.20 | 37.50 | 39.80 | 1.22 | 0.87 |
| TMGH | 22.45 | 21.80 | 23.60 | 1.45 | 0.98 |
| ABUK | 15.70 | 15.20 | 16.40 | 1.05 | 0.62 |
| SWDY | 9.80 | 9.40 | 10.20 | 1.10 | 0.70 |
---
Overall Market Liquidity Ratio
The market’s overall liquidity ratio (traded stock value divided by total market capitalization) stood at 0.042 today, meaning roughly 4.2 % of market value changed hands during the session, indicating moderate trading activity with a cautious investor bias.
---
Summary and Recommendations
- Overall Trend: Negative, with selling pressure dominating most stocks, especially evident in the EGX70 index, which showed clear weakness.
- Support and Resistance: The EGX30 finds important support near the 28,000‑point level, with the nearest resistance around 29,000 points. For the EGX70, critical support is at 5,600 points and resistance at 6,100 points.
- Stocks That May Show Resilience: TMGH exhibits strong support at EGP 21.80 and healthy liquidity ratios, making it a candidate for a bounce if global liquidity improves. COMI also retains a support level at EGP 37.50 with moderate liquidity.
- Sectors Under Pressure: Petrochemicals, transport, and logistics continue to face strain from the widening oil‑trade deficit and OPEC’s negative demand outlook. The real‑estate sector could benefit from affordable‑housing initiatives and insurance partnerships, as exemplified by TMGH.
- Macro Risks: Persistent expansion of the non‑oil trade deficit, coupled with tightening global monetary policy, may trigger capital outflows from emerging markets, increasing market volatility.
Advisory View: In the current environment, focus on stocks with strong fundamentals and good liquidity, and consider using stop‑loss orders to protect capital from sharp adverse moves.
---
Live Egyptian Equities Coverage
Track real-time quotes, order book market depth, and quantitative technical analytics for all 299 listed companies.
Open Real-Time Market Terminal →