


Morning Briefing on the Egyptian Stock Exchange – Analysis of Indicators and Key Stocks - 17 September 2026
Morning Briefing on the Egyptian Stock Exchange – Analysis of Indicators and Key Stocks - 17 September 2026
---
Overview of the Macro Environment
Global markets are in a state of anticipation following the first interest rate hike by the U.S. Federal Reserve in three years, a 25 basis point increase that has pushed U.S. Treasury yields higher and strengthened the dollar against emerging-market currencies. Domestically, the Egyptian government continues to implement market‑supportive policies through:
- Adoption of the second version of the State Ownership Policy Document, which includes a detailed plan for the second tranche and paves the way for listing government assets on the exchange.
- A decision by the Financial Regulatory Authority to prohibit consumer‑finance companies from trading in gold and silver, aiming to channel liquidity toward traditional financial instruments.
- Ongoing Saudi efforts to bypass the impact of the Strait of Hormuz by rerouting oil shipments via Oman, easing pressure on energy‑linked commodity prices.
- The Central Bank of Egypt’s announcement of treasury bond auctions worth EGP 5 billion at a yield of 23.59 %, reflecting continued attraction of domestic liquidity to high‑yield instruments.
Together, these factors create a mixed environment where U.S. monetary tightening exerts capital‑outflow pressure on emerging markets, while local structural reforms and expansionary fiscal policies bolster investor appetite for stocks with strong fundamentals and defensive sectors.
---
Indices Analysis
#### EGX30 Index

The EGX30 index edged down 0.16 % in the previous session, closing at 54,800 points. The index is trading within a narrow channel between support at 54,200 points and resistance at 55,500 points. Average daily volume is close to 1.2 million shares, indicating interest from mid‑sized investors, though there is selling pressure from foreign funds that continued net selling of USD 289.8 million in the secondary market for government debt instruments.
#### EGX70 Index

Conversely, the EGX70 index rose 0.15 % to close at 21,400 points. The increase reflects relative strength in small‑ and mid‑cap stocks, particularly those linked to the technology and non‑banking financial sectors. The seven‑day RSI stands at 58, signalling moderate positive momentum without clear overbought conditions.
Analytical Note: The divergence between EGX30 and EGX70 highlights a sectoral rotation where investors favor lower‑liquidity, growth‑story stocks, while large‑cap stocks remain under pressure relative to rising global interest rates.
#### Daily Performance Comparison Table
| Index | Close (Points) | Daily Change | Volume (Million Shares) | RSI (14) |
|---|---|---|---|---|
| EGX30 | 54,800 | -0.16 % | 1.2 | 48 |
| EGX70 | 21,400 | +0.15 % | 0.9 | 58 |
---
Key Stocks Analysis
#### Commercial International Bank (COMI)
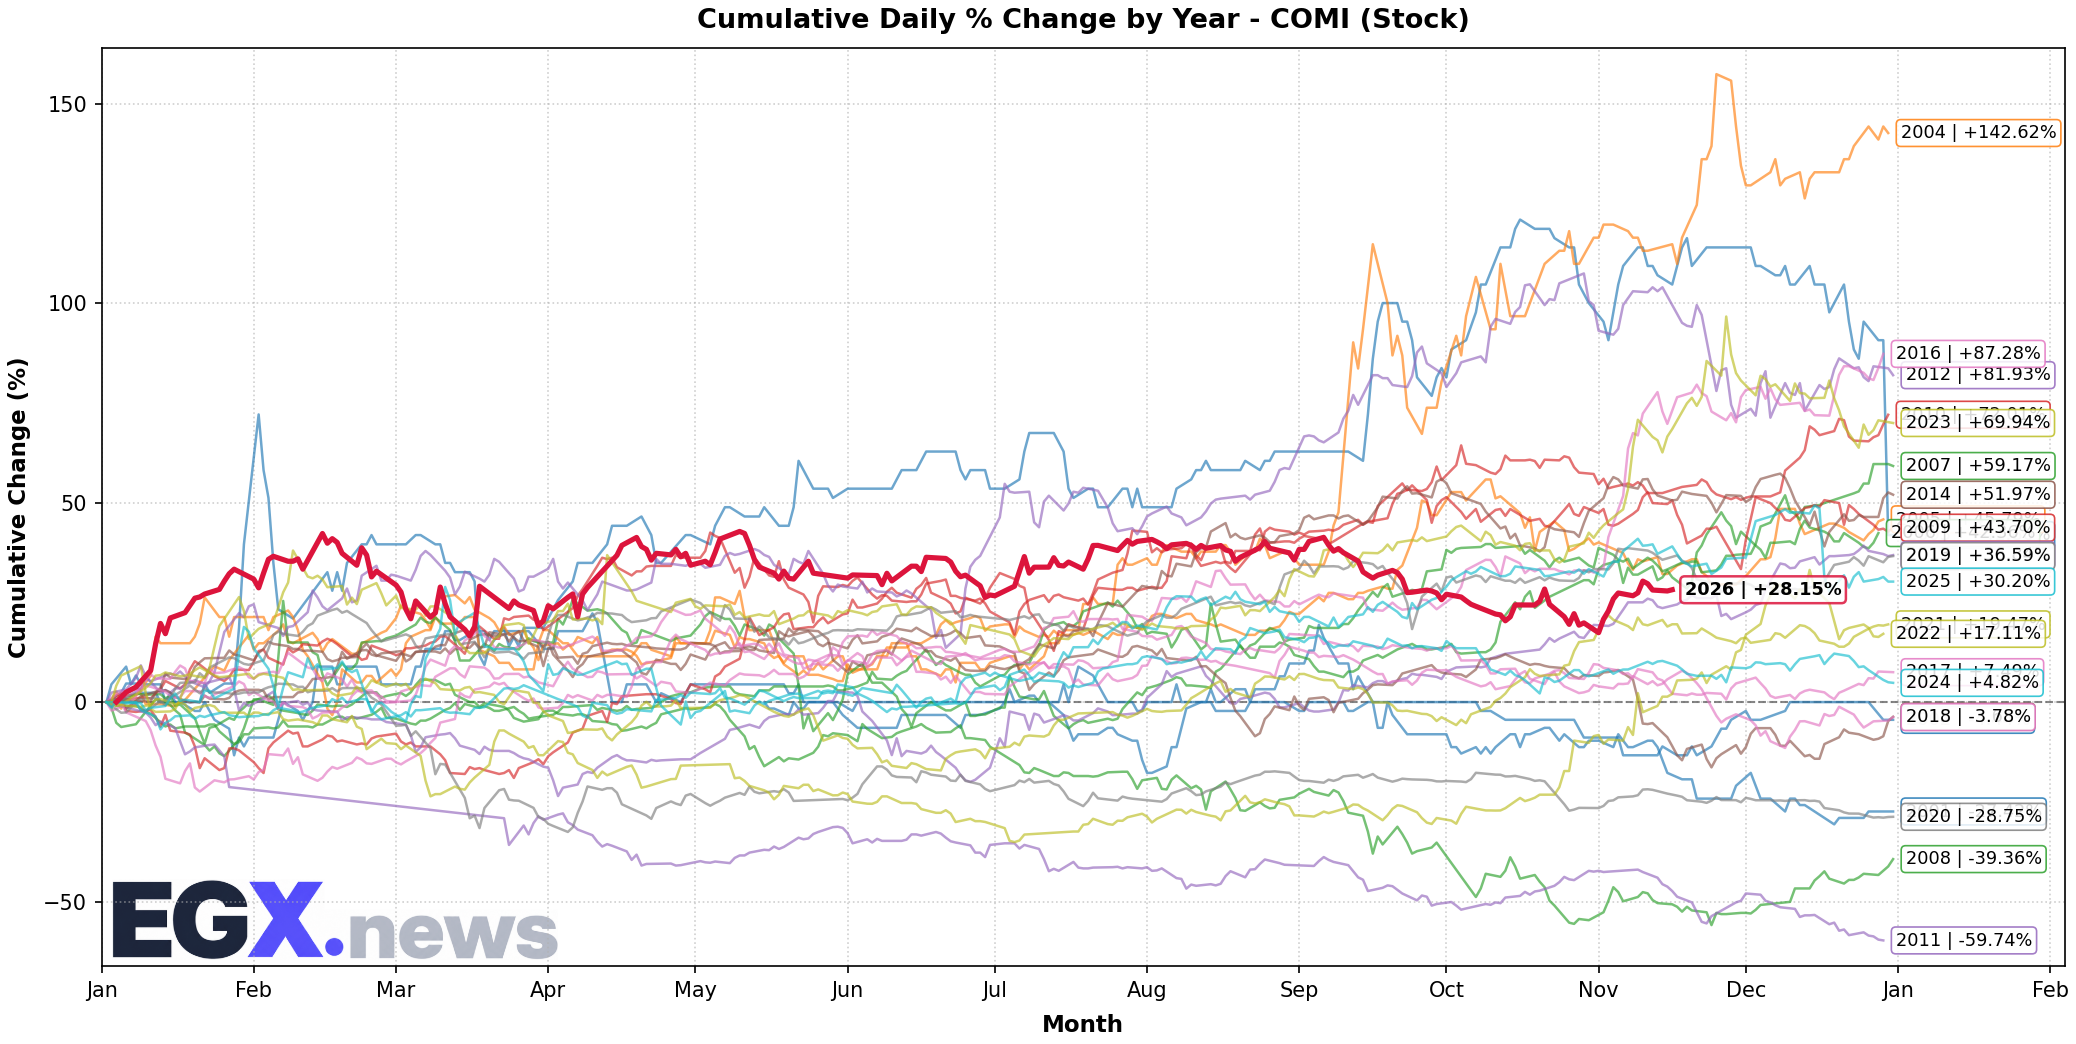
- Technical Performance: The stock is trading above its 50‑day moving average at EGP 112, with strong support at EGP 108 and initial resistance at EGP 118. Buying volume rises on dips, indicating institutional accumulation.
- Fundamentals: The bank has benefited from U.S. and Egyptian rate hikes, improving its net interest margin (NIM). Furthermore, it received a Forbes ranking as one of the world’s best‑performing banks in 2026, boosting confidence in asset quality.
- Supporting Factors: Continued growth in corporate and retail lending, along with improved asset quality after stricter IFRS 9 implementation.
- Outlook: Breaking the EGP 118 resistance could open the path to EGP 125 in the short term, with a possible retreat to the EGP 110‑115 range if global liquidity pressure persists.
#### EFG Holding (EFID)
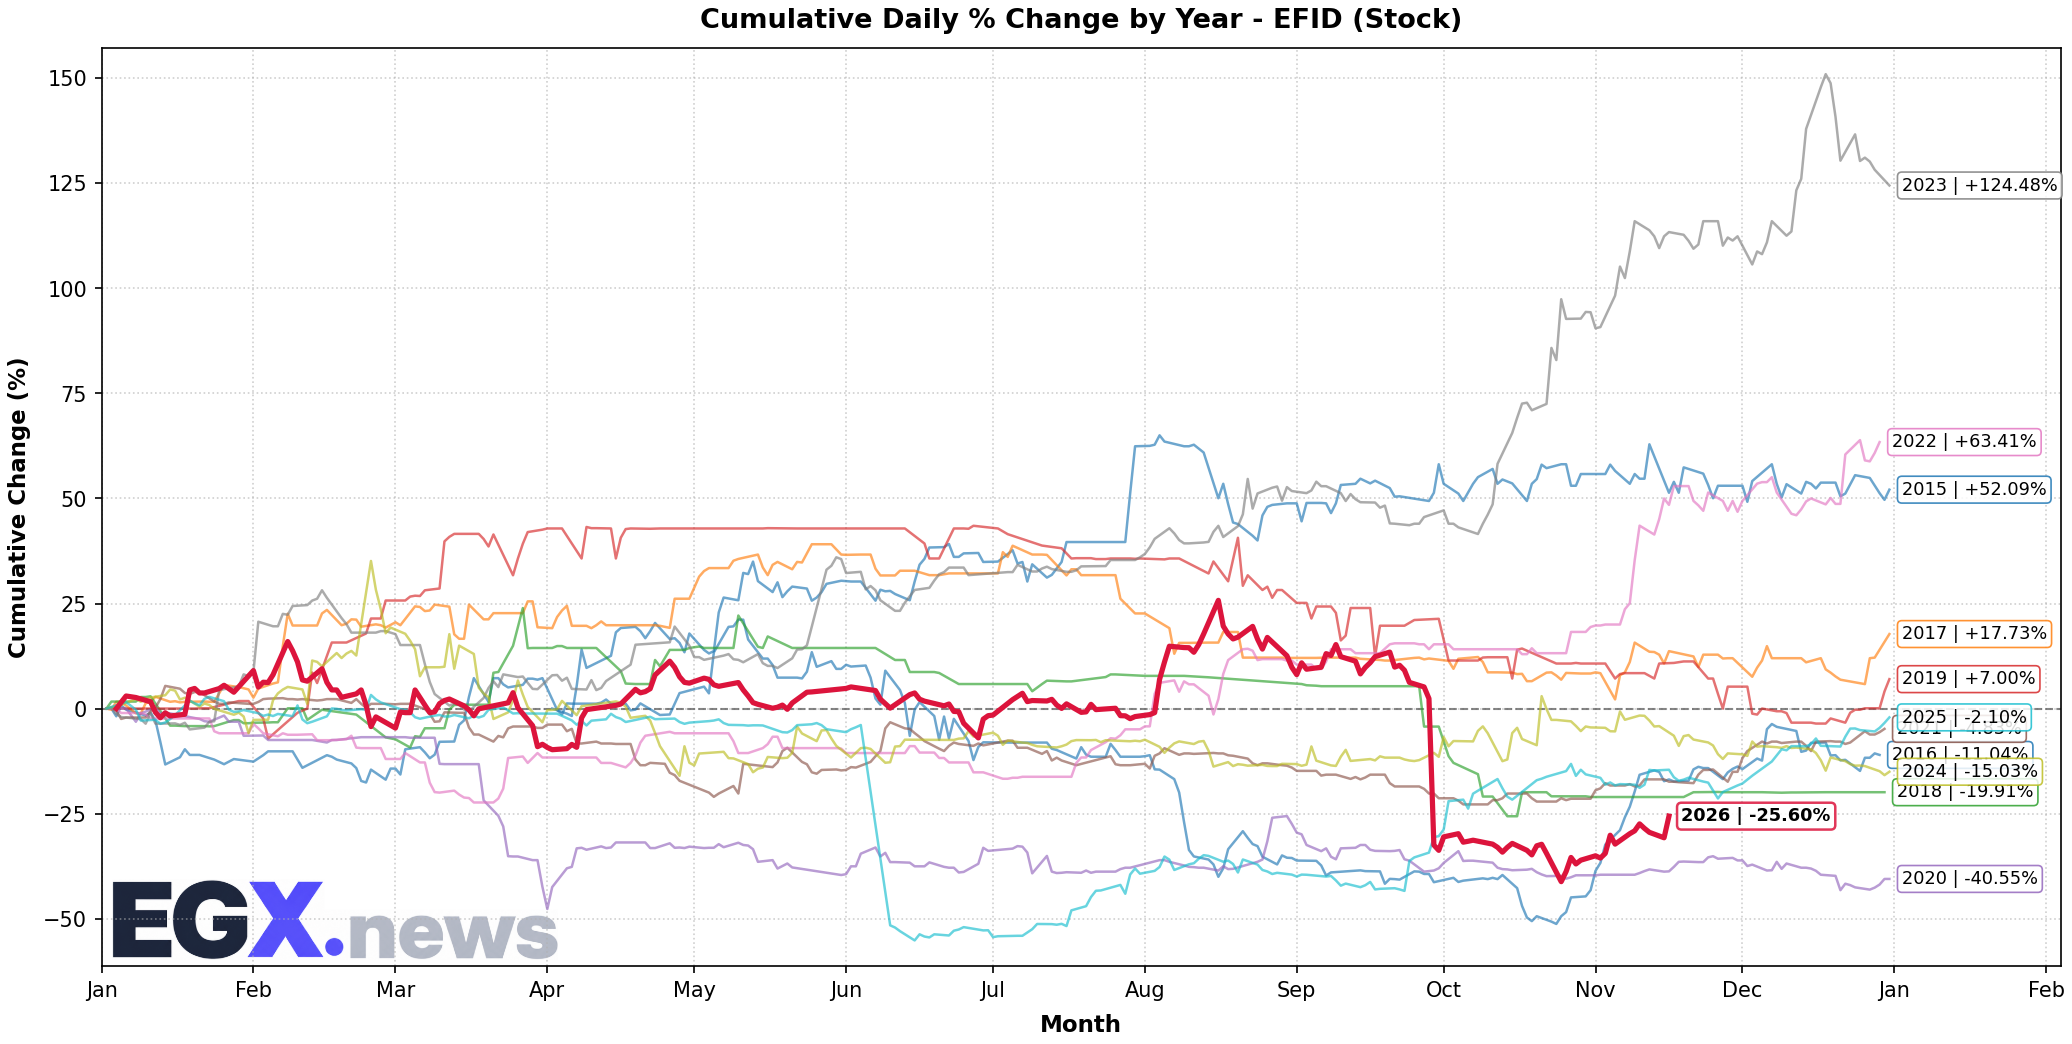
- Technical Performance: The stock has formed a series of higher lows since early August, currently trading at EGP 27.5 with a mild upward trend (slope ≈ +0.3 % per session). Nearby resistance is at EGP 29.
- Fundamentals: The company is expanding its wealth‑management and brokerage platforms, benefiting from a growing base of individual investors after the ban on consumer financing in precious metals. Internal reports show a 12 % quarter‑over‑quarter increase in brokerage accounts.
- Supporting Factors: A high‑interest‑rate environment enhances the appeal of the fixed‑income products it distributes via its platforms.
- Outlook: Closing above EGP 29 with above‑average volume could test the next resistance at EGP 31; a drop below EGP 26 may signal a temporary correction toward EGP 24.
#### Suez Canal Electric Company (SWDY)
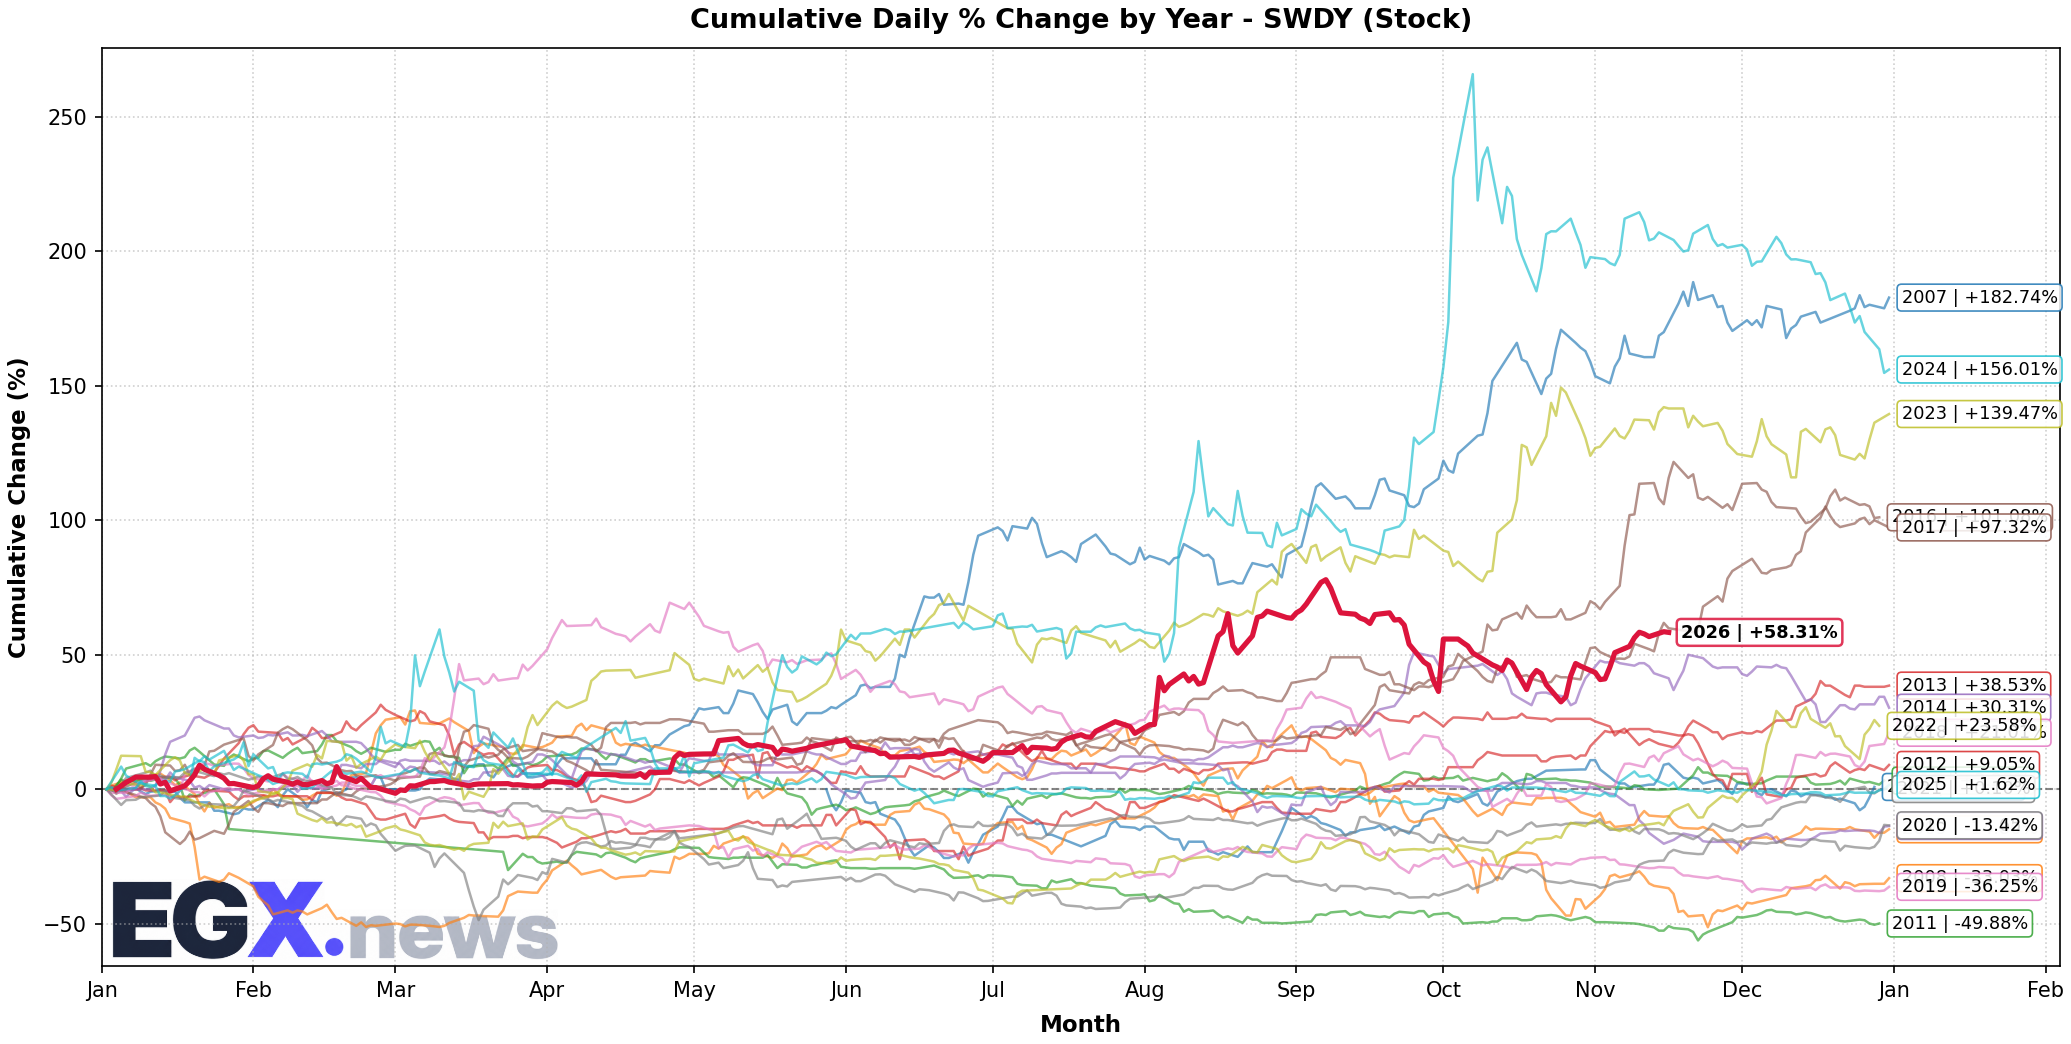
- Technical Performance: The stock is testing short‑term resistance at EGP 42 on strong upward volume, with support at EGP 38. The MACD shows a positive crossover.
- Fundamentals: SWDY gains from the redirection of Saudi oil exports via Oman, reducing supply‑chain disruptions and boosting demand for power cables and transformers used in renewable‑energy projects and infrastructure.
- Supporting Factors: Increased government spending on solar and wind projects, plus new supply contracts with private power generators.
- Outlook: Breaking EGP 42 could push the stock toward EGP 46‑48 in the medium term, while monitoring support at EGP 38 as the first line of defense.
#### Talaat Mostafa Group (TMGH)
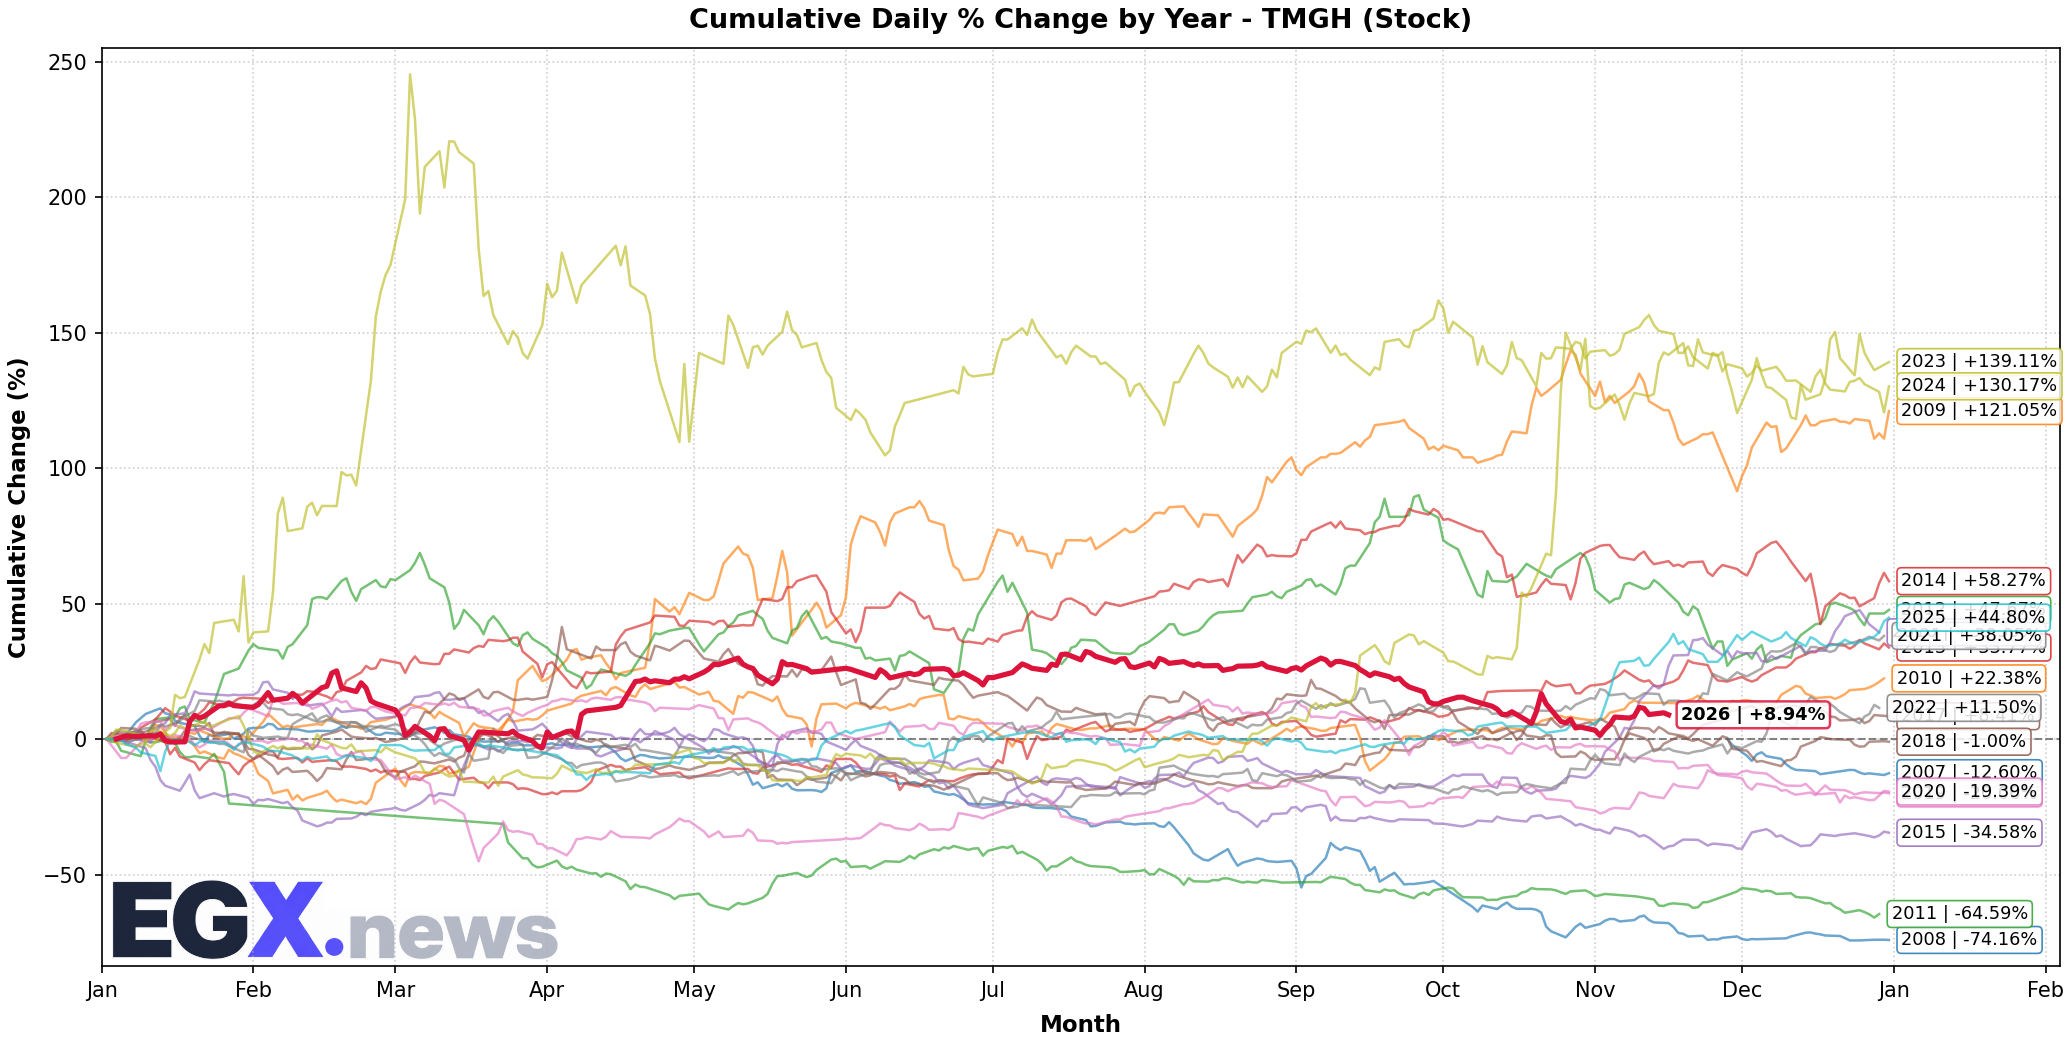
- Technical Performance: The stock faces repeated resistance at EGP 62 with long upper shadows, reflecting weak buying interest at higher levels. Main support is at EGP 56.
- Fundamentals: The company is under pressure from rising financing costs due to global rate hikes, coupled with signs of declining demand for residential units amid rising construction costs.
- Negative Factors: Sector reports indicate slow pre‑sales for new projects and rising unsold inventory.
- Outlook: A break below the EGP 56 support could lead to a decline toward EGP 50‑52 in the short term, while stabilization above EGP 60 with renewed volume might signal a weak recovery attempt.
#### Summary Table of Key Stocks
| Stock | Current Price (EGP) | Support (EGP) | Resistance (EGP) | Short‑Term Trend | Main Comment |
|---|---|---|---|---|---|
| COMI | 112 | 108 | 118 | Moderately bullish | Higher rates improve NIM; Forbes ranking |
| EFID | 27.5 | 26 | 29 | Slightly bullish | Brokerage‑account growth after gold ban |
| SWDY | 40.5 | 38 | 42 | Increasingly bullish | Benefit from Saudi oil reroute via Oman |
| TMGH | 59.0 | 56 | 62 | Bearish/Neutral | Rising financing costs; weakening real‑estate demand |
---
Session‑Opening Expectations
Based on prior data and technical indicators, the market is expected to open with a mixed tone:
- EGX30: May open near the support level of 54,200‑54,400 points, with a gentle upward bias if buying interest continues in large‑cap financial stocks (especially COMI) and basic resources (SWDY).
- EGX70: Likely to maintain the modest rise seen in the previous session, driven by momentum in technology and non‑banking financial stocks, with a possible test of resistance at 21,600‑21,800 points.
- Volume: Daily volume is projected to stay within the 1.0‑1.4 million‑share range, with greater focus on medium‑ and high‑liquidity stocks.
- Influencing Factors: Any new statement from the Federal Reserve chairman on the future rate path, or geopolitical developments concerning the Strait of Hormuz, could quickly shift intraday direction. Traders are advised to place tight stop‑loss orders and continuously monitor U.S. Treasury‑yield indicators.
---
Conclusion and Recommendations
Conclusion: The current economic setting blends global monetary tightening with domestic structural support, creating selective opportunities in stocks with solid fundamentals and sectors that benefit from higher interest rates or from the rerouting of energy‑linked goods.
Recommendations:
1. Financials: Increase the relative weight of COMI in portfolios seeking stable income with moderate upside potential; set a price target of EGP 118‑125 with a stop‑loss at EGP 106.
2. Finance & Investment: Consider EFID as exposure to the non‑banking financial sector, anticipating growth in brokerage accounts; price target EGP 29‑31, stop‑loss at EGP 24.
3. Energy & Infrastructure: View SWDY as a defensive stock that gains from stable oil supplies via Oman; price target EGP 42‑48, stop‑loss at EGP 36.
4. Real Estate: Reduce exposure to TMGH until clear signs of stabilizing property demand or declining financing costs appear; treat the EGP 50‑55 range as a short‑term trading zone, ready to exit if the price falls below EGP 50.
Key Monitoring Points:
- Movements in U.S. Treasury yields (especially the 10‑year) as a driver of liquidity flows.
- Any news on gold prices and its impact on the consumer‑finance ban in precious metals.
- Banks’ cash‑flow reports following the local treasury‑bond auctions to gauge their effect on market liquidity.
Live Egyptian Equities Coverage
Track real-time quotes, order book market depth, and quantitative technical analytics for all 299 listed companies.
Open Real-Time Market Terminal →