


GROV
BIGPGROV
Company Overview & Activities
•تجارة وتسويق قطع غيار واكسسوارات السيارات والمواتير والبطاريات والكاوتش والتوريدات العمومية •تصنيع وتصميم وتجميع وتجهيز السيارات والاتوبيسات والميكروباصات وقطع غيارها والمعدات والدرجات البخارية وكافة انواع وسائل النقل الثقيل والخفيف والالات الزراعية بواسطة الشركة او الغير وشراء وبيع السيارات وجميع الغيار وكافه الاجزاء او المكونات اللازمة لها . •اقامة محطات توليد الطاقة الكهربائية ومحطات شحن الطاقة الكهربائية للسيارات ولجميع وسائل النقل واقامة محطات توليد الطاقة المتجددة (الطاقه الشمسيه ،و طاقه الرياح ، و الطاقه المائيه )وانشاء كافة المرافق والمنشأت اللازمة لذلك لاستهلاك الانتاج بواسطه الشركة او الغير وشراء وبيع جميع قطع الغيار وكافة الاجزاء او المكونات اللازمه لها . •تصميم البرمجيات وانتاج المحتوي الالكتروني وقواعد البيانات والتطبيقات بمختلف انواعها واعمال انتاج وتطوير البرامج والتطبيقات وانشاء قواعد البيانات ونظم المعلومات الالكترونية وتشغيلها والتدرب عليها وانتاح المحتوي الالكتروني بصوره مختلفه من صوت وبيانات وادخال البيانات علي الحاسبات بالوسائل •الاستثمار العقاري والسي
EGS551D1C017
Listed on EGX
FRA Certified Auditor
Financial FAQ & Technical Outlook for GROV (BIGP)
Quantitative Technical Engine (BIGP)
ElBarbary Investment holds a Neutral technical posture (Overall Score: 57.8/100) with Trend Score 35/100, Momentum Score 90/100 (RSI 52.34 - Bullish Momentum), and Volume Score 70/100 (accumulating, 0.75x 20D baseline).
Support & Resistance Confluence Matrix
AlgorithmicNearest support is at 0.22 [Strength: 83.8/100, Tier 1 (Macro 500D)] (4.35% below price with a 95.0% confirmed bounce rate across 20 tests, Reliability: High). Nearest resistance is at 0.24 [Strength: 65.0/100, Tier 3 (Intraday 1-min)] (4.35% above price with a 100.0% confirmed rejection rate across 1543 tests, Reliability: High).
Seasonal Trend & Historical Patterns (BIGP)
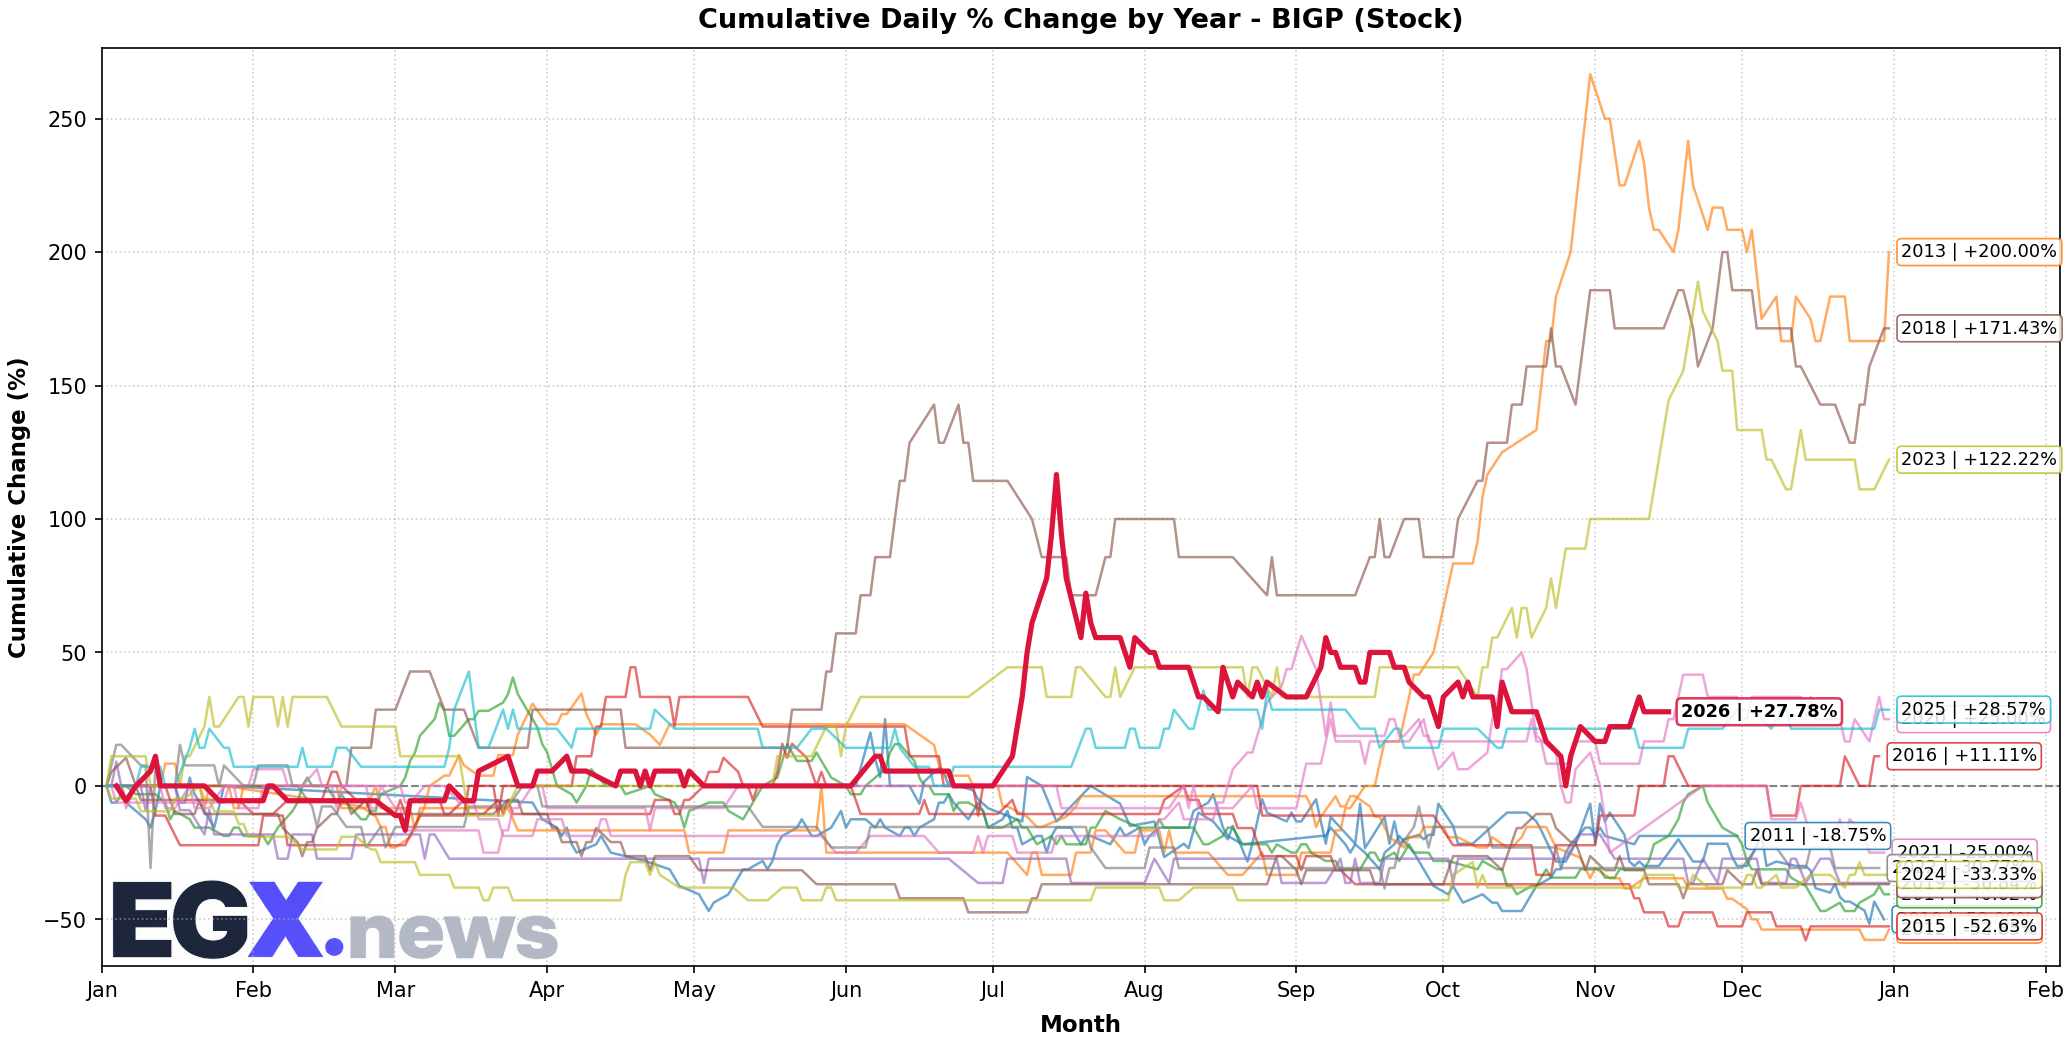
Click to EnlargeHistorical monthly seasonal return distribution and performance cycles for BIGP.
Trend Structure & Moving Averages
Golden Cross (457D)Trend Score is 35/100 with price trading 4.55% above its 20-day SMA and above the 200-day long-term benchmark (SMA50 is above SMA200 for 457 sessions).
Momentum, Volume Flow & Volatility
RSI(14) is 52.34 (Bullish Momentum), moving -0.86 over the past 5 sessions — indicating positive momentum in buyer territory. MACD line (-0.0) is above signal line (-0.003) with a histogram of +0.003 (Bullish Momentum).
20-day annualized volatility is 75.82%, ATR(14) is 0.02 (8.7% of price), and price is trading in the middle channel (%B: 0.667, Bandwidth: 27.27%).
Statistical Backtests & Historical Win Rates
BacktestedEmpirical backtesting reveals that RSI oversold dips (<30) historically yield an average 20-day return of +2.17% with a 37.5% win rate (104 observations, Reliability: High), while volume spikes yield an average 20-day return of +4.08% (38.84% win rate).
Price sits 69.33% below All-Time High (0.75 set 3656 sessions ago on 2010-06-09) and 42.5% below its 52-week high (0.4 on 2026-07-15).