


Heliopolis Housing
HELIHeliopolis Housing
Company Overview & Activities
القيام بكافة الأعمال المتعلقة بمشروعات الإسكان و التعمير سواء داخل الجمهورية أو خارجها علي وجه خاص ما يأتي:- (أ)الحصول علي كافة الأراضي و العقارات اللازمة للمشروعات السابق ذكرها بطريق الشراء و التخصيص او اية طريقة أخر و إقامة المباني عليها و التصرف فيها بكافة أنواع التصرفات لحساب الشركة أو لحساب هيئات أو مؤسسات او جمعيات او شركات او أي جهة اخري. (ب)القيام بالتطوير العقاري بنفسها او عن طريق الغير بتجهيز الأراضي و تخطيطها و تقسيمها و تزويدها بالمرافق و الخدمات اللازمة للعمران طبقا للقوانين السارية, كما تقوم الشركة كذلك لحسابها و لحساب الغير باعداد و تنفيذ ما يعد عليها من مشروعات التخطيط و التعمير و تقسيم الأراضي و انشاء المدن الجديدة و القري السياحية وما يلزم لهذة المشروعات من مختلف المرافق. (ج)تتولي الشركة تنظيم و تخطيط و بيع الأراضي التي تمتلكها او اديرها لحساب الغير. (د)القيام بنفسها او بواسطة الغير باعمال التصميم و الاشراف علي التنفذ للمشروعات المحلية او المشروعات المستثمر فيها المال العربي او الأجنبي. (ه)القيام بنفسعا او عن طريق الغير بعمليات انشاء المساكن و كذلك الانشاءات ذات
EGS65591C017
1995-05-07
FRA Certified Auditor
Financial FAQ & Technical Outlook for Heliopolis Housing (HELI)
Quantitative Technical Engine (HELI)
Heliopolis Housing holds a Neutral technical posture (Overall Score: 59.2/100) with Trend Score 35/100, Momentum Score 80/100 (RSI 49.9 - Neutral), and Volume Score 70/100 (accumulating, 0.45x 20D baseline).
Support & Resistance Confluence Matrix
AlgorithmicNearest support is at 6.84 [Strength: 45.0/100, Tier 3 (Intraday 1-min)] (0.87% below price with a 100.0% confirmed bounce rate across 1 tests, Reliability: Low). Nearest resistance is at 7.01 [Strength: 45.0/100, Tier 3 (Intraday 1-min)] (1.59% above price with a 100.0% confirmed rejection rate across 1 tests, Reliability: Low).
Seasonal Trend & Historical Patterns (HELI)
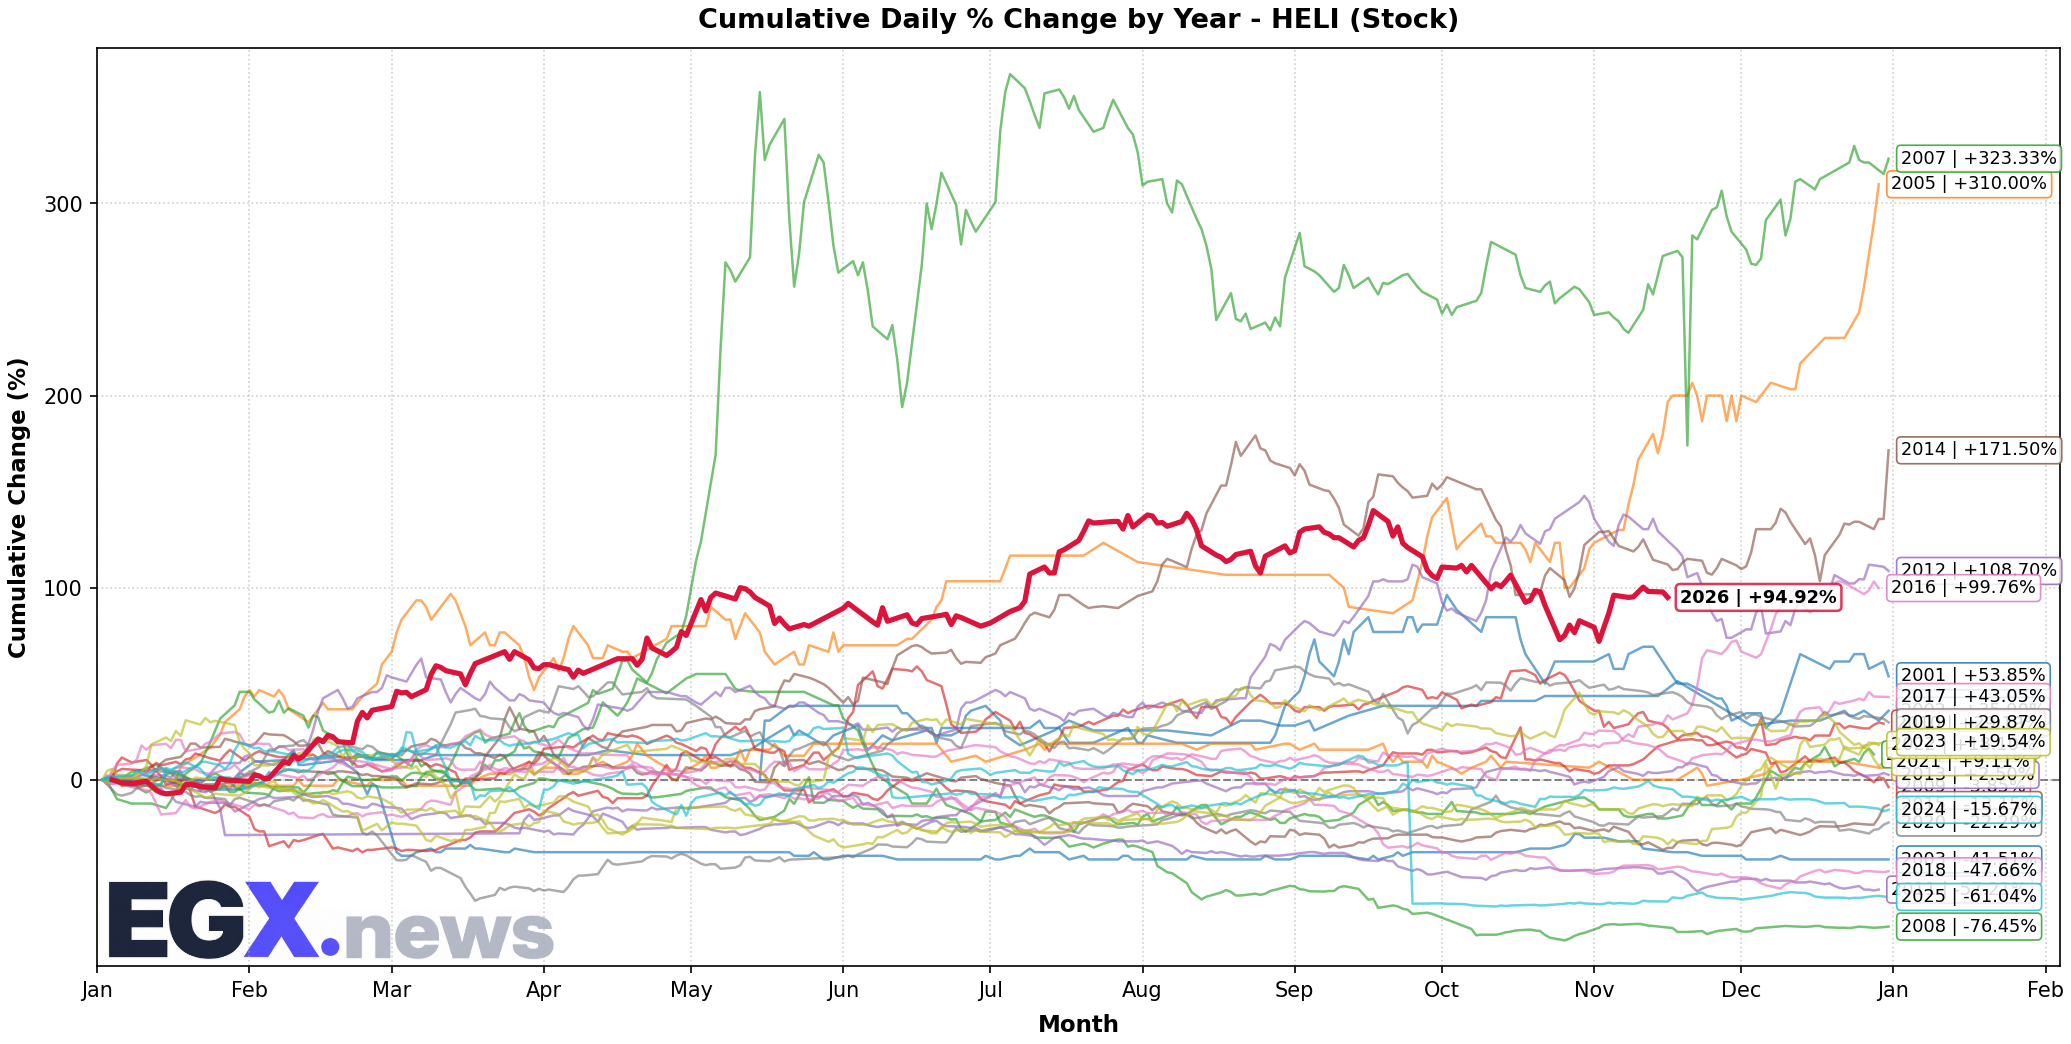
Click to EnlargeHistorical monthly seasonal return distribution and performance cycles for HELI.
Trend Structure & Moving Averages
Golden Cross (119D)Trend Score is 35/100 with price trading 3.45% above its 20-day SMA and above the 200-day long-term benchmark (SMA50 is above SMA200 for 119 sessions).
Momentum, Volume Flow & Volatility
RSI(14) is 49.9 (Neutral), moving -1.12 over the past 5 sessions — indicating a balanced / consolidation posture. MACD line (-0.043) is above signal line (-0.136) with a histogram of +0.092 (Bullish Momentum).
20-day annualized volatility is 54.29%, ATR(14) is 0.3 (4.35% of price), and price is trading in the middle channel (%B: 0.667, Bandwidth: 21.14%).
Statistical Backtests & Historical Win Rates
BacktestedEmpirical backtesting reveals that RSI oversold dips (<30) historically yield an average 20-day return of +1.68% with a 51.33% win rate (113 observations, Reliability: High), while volume spikes yield an average 20-day return of +3.04% (53.64% win rate).
Price sits 50.54% below All-Time High (13.95 set 636 sessions ago on 2024-03-04) and 21.32% below its 52-week high (8.77 on 2026-09-20).