


Telecom Egypt
ETELTelecom Egypt
Company Overview & Activities
انشاء وتملك وتشغيل و تطوير شبكات الاتصالات لنقل و تقديم خدمات الاتصالات وتكنولوجيا المعلومات داخل وخارج جمهورية مصر العربية وكافة الخدمات الاخرى الممكن تقديمها باستخدام الشبكات و التقنيات و التكنولوجيا السلكية و اللاسلكية ، ولها الحق في القيام بجميع الاعمال و الاختصاصات المؤدية لتحقيق غرضها وللشركة في سبيل تحقيق ذلك القيام بمايلي :- 1.تملك و انشاء و تشغيل و صيانة و تطوير شبكات الاتصالات و البنية الاساسية اللازمة لخدمات الاتصالات وذلك لاستخدامها و / او ادارتها و / او تاجيرها للغير و / او التعامل فيها . 2.تقديم خدمات الاتصال الصوتية و المرئية ونقل البيانات للمشتركين و / او ادارتها و / او تاجيرها للغير و التعامل فيها . 3.الاشتراك او المساهمة في انظمة الاتصالات العالمية مثل الكوابل البحرية و الاقمار الصناعية و الحصول على سعات او دوائر فيها وذلك لاستخدامها و / او ادارتها و / او تاجيرها للغير و / او التعامل فيها . 4.التعامل او التعاقد او الاشتراك مع الجهات او الهيئات او الشركات او المنظمات او اي كيانات تمارس نشاطا شبيها او مماثلا لنشاطات الشركة او يتصل بها او يعاونها على تحقيق اغراضه
EGS48031C016
1999-12-29
FRA Certified Auditor
Financial FAQ & Technical Outlook for Telecom Egypt (ETEL)
Quantitative Technical Engine (ETEL)
Telecom Egypt holds a Very Bullish technical posture (Overall Score: 86.2/100) with Trend Score 65/100, Momentum Score 100/100 (RSI 62.88 - Strong Bullish Momentum), and Volume Score 100/100 (accumulating, 2.51x 20D baseline).
Support & Resistance Confluence Matrix
AlgorithmicNearest support is at 142.27 [Strength: 45.0/100, Tier 3 (Intraday 1-min)] (0.51% below price with a 100.0% confirmed bounce rate across 1 tests, Reliability: Low). Nearest resistance is at 144.13 [Strength: 45.0/100, Tier 3 (Intraday 1-min)] (0.79% above price with a 100.0% confirmed rejection rate across 1 tests, Reliability: Low).
Seasonal Trend & Historical Patterns (ETEL)
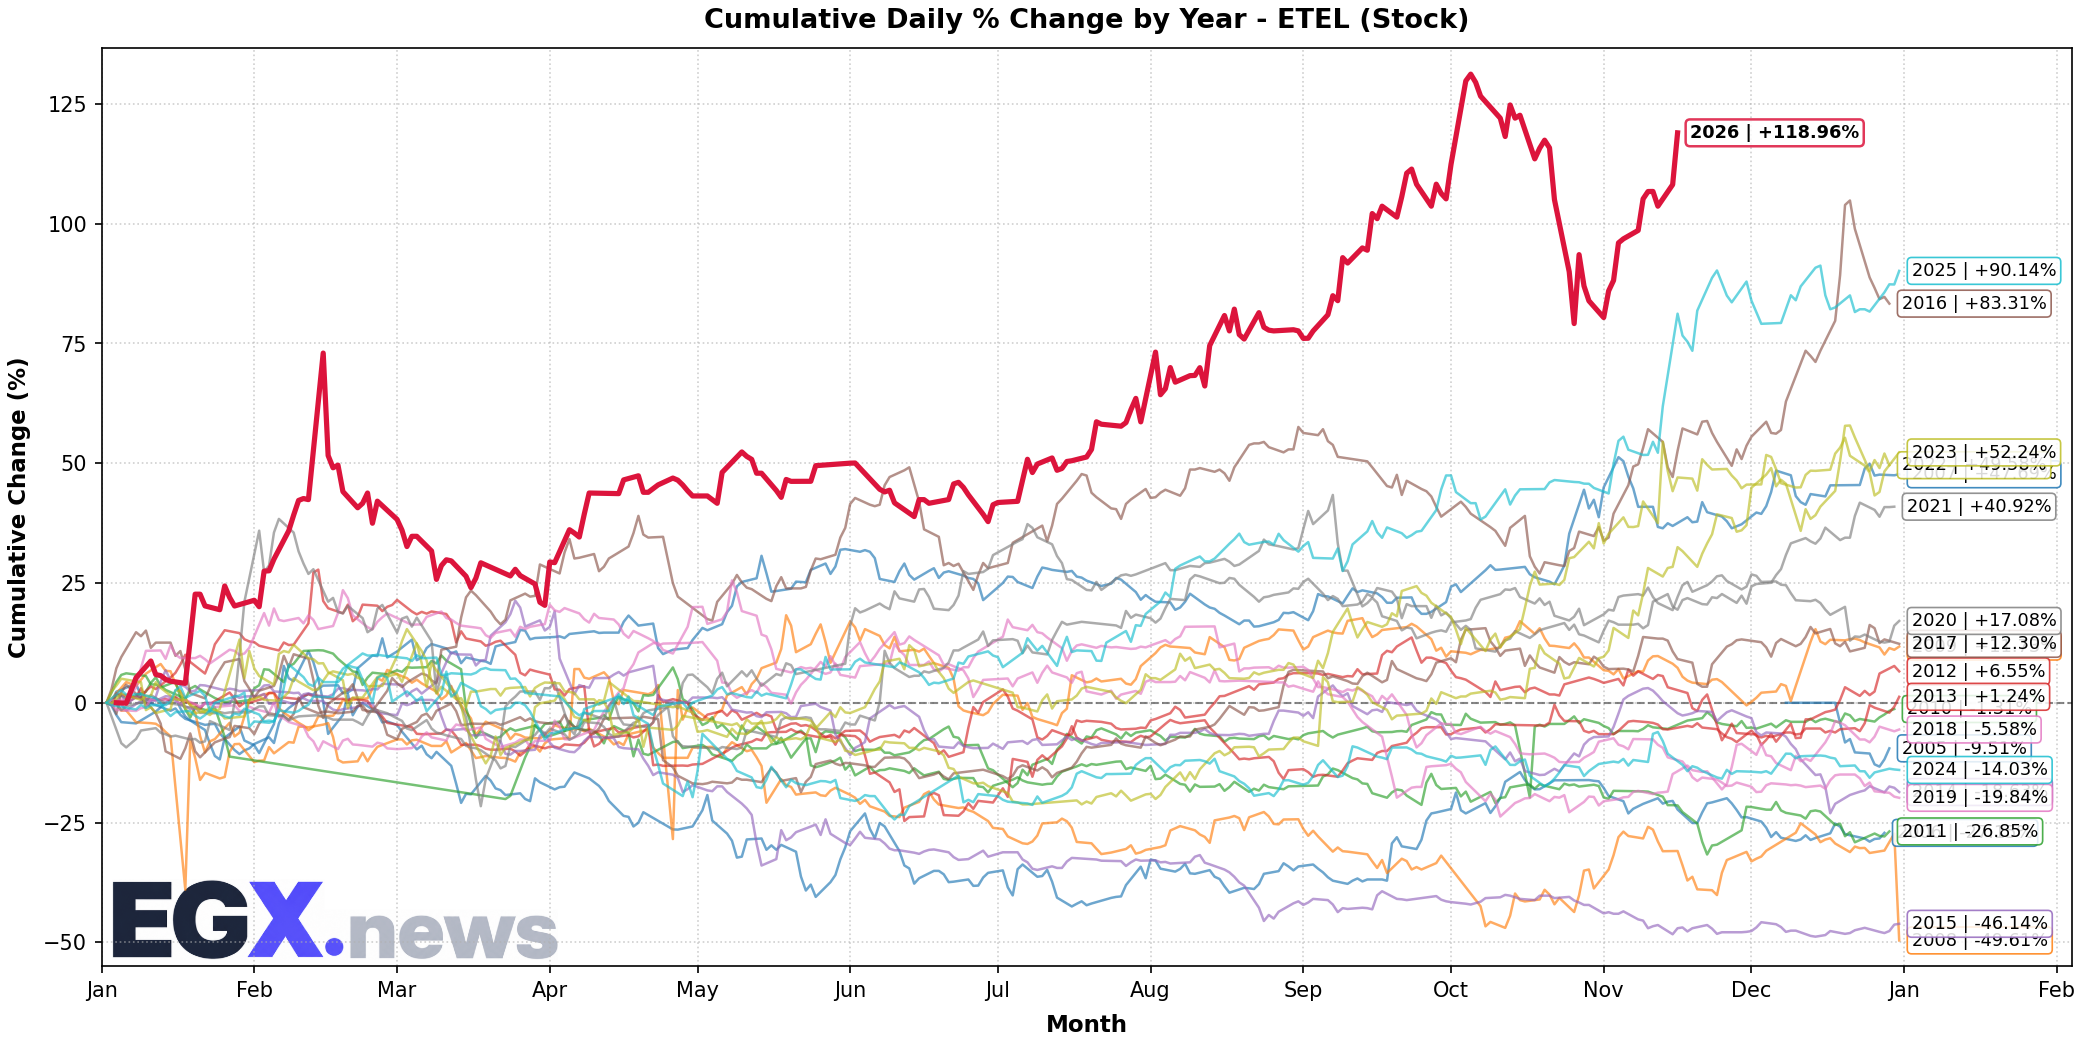
Click to EnlargeHistorical monthly seasonal return distribution and performance cycles for ETEL.
Trend Structure & Moving Averages
Golden Cross (434D)Trend Score is 65/100 with price trading 10.39% above its 20-day SMA and above the 200-day long-term benchmark (SMA50 is above SMA200 for 434 sessions).
Momentum, Volume Flow & Volatility
RSI(14) is 62.88 (Strong Bullish Momentum), moving +8.75 over the past 5 sessions — confirming powerful bullish upward pressure. MACD line (0.9) is above signal line (-0.786) with a histogram of +1.686 (Bullish Momentum).
20-day annualized volatility is 59.77%, ATR(14) is 5.94 (4.15% of price), and price is trading near the upper band (%B: 0.922, Bandwidth: 24.64%).
Statistical Backtests & Historical Win Rates
BacktestedEmpirical backtesting reveals that RSI oversold dips (<30) historically yield an average 20-day return of +3.85% with a 59.09% win rate (88 observations, Reliability: Good), while volume spikes yield an average 20-day return of +2.01% (54.81% win rate).
Price sits 8.33% below All-Time High (156.0 set 29 sessions ago on 2026-10-05) and 8.33% below its 52-week high (156.0 on 2026-10-05).