


Al Baraka Bank
SAUDAl Baraka Bank Egypt
Company Overview & Activities
بنك البركة يُعد من روّاد الصيرفة الإسلامية في مصر، حيث يقدّم مجموعة متكاملة من الخدمات المصرفية للأفراد والشركات وفق مبادئ الشريعة الإسلامية، تحت إشراف هيئة رقابة شرعية مستقلة. يتمتع البنك بخبرة تمتد لأكثر من 40 عامًا وشبكة تضم 43 فرعًا تغطي القاهرة والإسكندرية والدلتا، مع خطة للتوسع الجغرافي وزيادة عدد الفروع في مختلف المحافظات بحلول 2025. حصد البنك جائزة "البنك الإسلامي الأسرع نموًا" لعام 2022 من مجلة Global Business Outlook، كما تم إدراجه ضمن قائمة فوربس لأفضل 50 شركة في مصر لعامي 2022 و2023. ويعمل البنك حاليًا على تنفيذ استراتيجية جديدة لمدة ثلاث سنوات تشمل تطوير البنية التحتية والتكنولوجيا وتعزيز الخدمات لمواكبة التحول الرقمي. بنك البركة مصر هو جزء من مجموعة البركة ش.م.ب (م) التي يقع مقرها الرئيسي في البحرين، وتضم أكثر من 600 فرع في 13 دولة عبر ثلاث قارات
EGS60101C010
1984-12-25
FRA Certified Auditor
Financial FAQ & Technical Outlook for Al Baraka Bank Egypt (SAUD)
Quantitative Technical Engine (SAUD)
Al Baraka Bank holds a Bullish technical posture (Overall Score: 70.8/100) with Trend Score 65/100, Momentum Score 100/100 (RSI 60.05 - Strong Bullish Momentum), and Volume Score 45/100 (accumulating, 2.19x 20D baseline).
Support & Resistance Confluence Matrix
AlgorithmicNearest support is at 22.3 [Strength: 45.0/100, Tier 3 (Intraday 1-min)] (1.33% below price with a 100.0% confirmed bounce rate across 1 tests, Reliability: Low). Nearest resistance is at 22.75 [Strength: 55.2/100, Tier 3 (Intraday 1-min)] (0.66% above price with a 60.7% confirmed rejection rate across 28 tests, Reliability: High).
Seasonal Trend & Historical Patterns (SAUD)
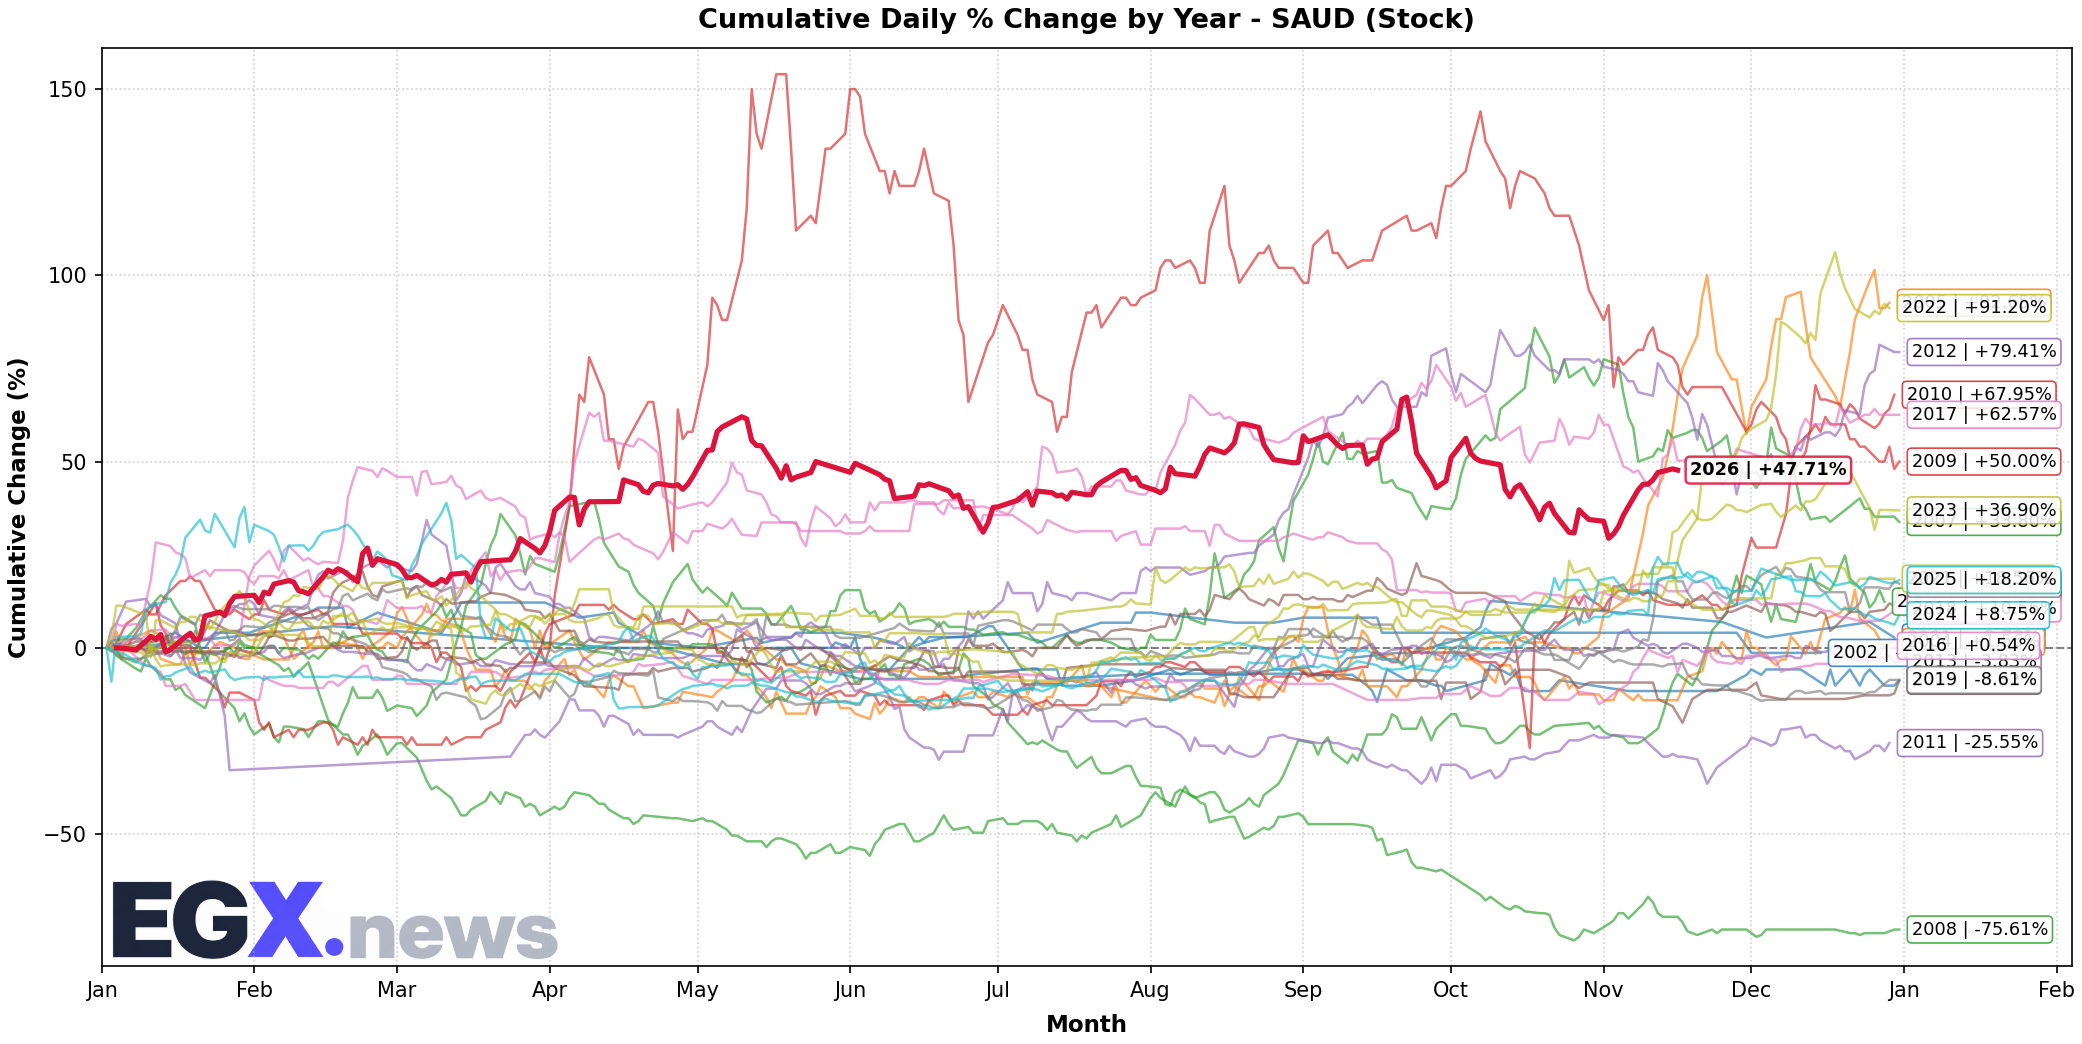
Click to EnlargeHistorical monthly seasonal return distribution and performance cycles for SAUD.
Trend Structure & Moving Averages
Golden Cross (282D)Trend Score is 65/100 with price trading 6.96% above its 20-day SMA and above the 200-day long-term benchmark (SMA50 is above SMA200 for 282 sessions).
Momentum, Volume Flow & Volatility
RSI(14) is 60.05 (Strong Bullish Momentum), moving +4.36 over the past 5 sessions — confirming powerful bullish upward pressure. MACD line (0.126) is above signal line (-0.197) with a histogram of +0.323 (Bullish Momentum).
20-day annualized volatility is 35.27%, ATR(14) is 0.83 (3.67% of price), and price is trading near the upper band (%B: 0.891, Bandwidth: 17.84%).
Statistical Backtests & Historical Win Rates
BacktestedEmpirical backtesting reveals that RSI oversold dips (<30) historically yield an average 20-day return of +1.82% with a 58.51% win rate (94 observations, Reliability: Good), while volume spikes yield an average 20-day return of +3.62% (54.52% win rate).
Price sits 14.23% below All-Time High (26.35 set 39 sessions ago on 2026-09-21) and 14.23% below its 52-week high (26.35 on 2026-09-21).