


Export Development Bank of
EXPAExport Development Bank of Egypt
Company Overview & Activities
ممارسة أنشطة و عمليات البنوك و الخدمات و المعاملات المصرفية بكافة انوعها , و علي وجه العموم القيام بالعمليات المصرفية و الاعمال التجارية و المالية و الاستثمارية المصرح بها للبنوك التجارية وكل ما يجري العرف المصرفي علي اعتباره من اعمال البنوك ووفقا للقوانين السارية , و من ذللك علي سبيل المثال لا الحصر : 1.تقديم التمويل و التسهيلات الائتمانية مختلفة الاجال , و ذلك بالعملة المصرية و غيرها , و كذا الحصول علي التمويل من الداخل و الخارج . 2.فتح الحسابات الجارية و قبول الودائع بمختلف أنواعها بالعملة المصرية و الأجنبية . 3.تقديم العمليات المصرفية المتعلقة بتنمية الصادرات المصرية . 4.اصدار خطابات الضمان و الضمان المقابل . 5.تقديم نظم و خدمات الدفع و التكنولوجيا المالية . 6.اعمال تاجير الخزائن . 7.اصدار الأسهم و الصكوك و السندات و الأوراق المالية الأخرى بكافة أنواعها المصرفية و المصرفية الإسلامية في الأسواق المحلية و الخارجية نيابة عن الغير و تلقي و تغطية الاكتتابات و مزاولة جميع الاعمال المتعلقة بها وفقا للقانون . 8.تحصيل و دفع الاوامر و اذون الصرف و غيرها من الأوراق ذات ا
EGS60241C014
1995-12-14
FRA Certified Auditor
Financial FAQ & Technical Outlook for Export Development Bank of Egypt (EXPA)
Quantitative Technical Engine (EXPA)
Export Development Bank of holds a Bullish technical posture (Overall Score: 62.0/100) with Trend Score 30/100, Momentum Score 80/100 (RSI 43.22 - Neutral), and Volume Score 70/100 (accumulating, 0.43x 20D baseline).
Support & Resistance Confluence Matrix
AlgorithmicNearest support is at 14.61 [Strength: 53.3/100, Tier 3 (Intraday 1-min)] (0.2% below price with a 53.3% confirmed bounce rate across 15 tests, Reliability: High). Nearest resistance is at 14.79 [Strength: 45.0/100, Tier 3 (Intraday 1-min)] (1.02% above price with a 100.0% confirmed rejection rate across 1 tests, Reliability: Low).
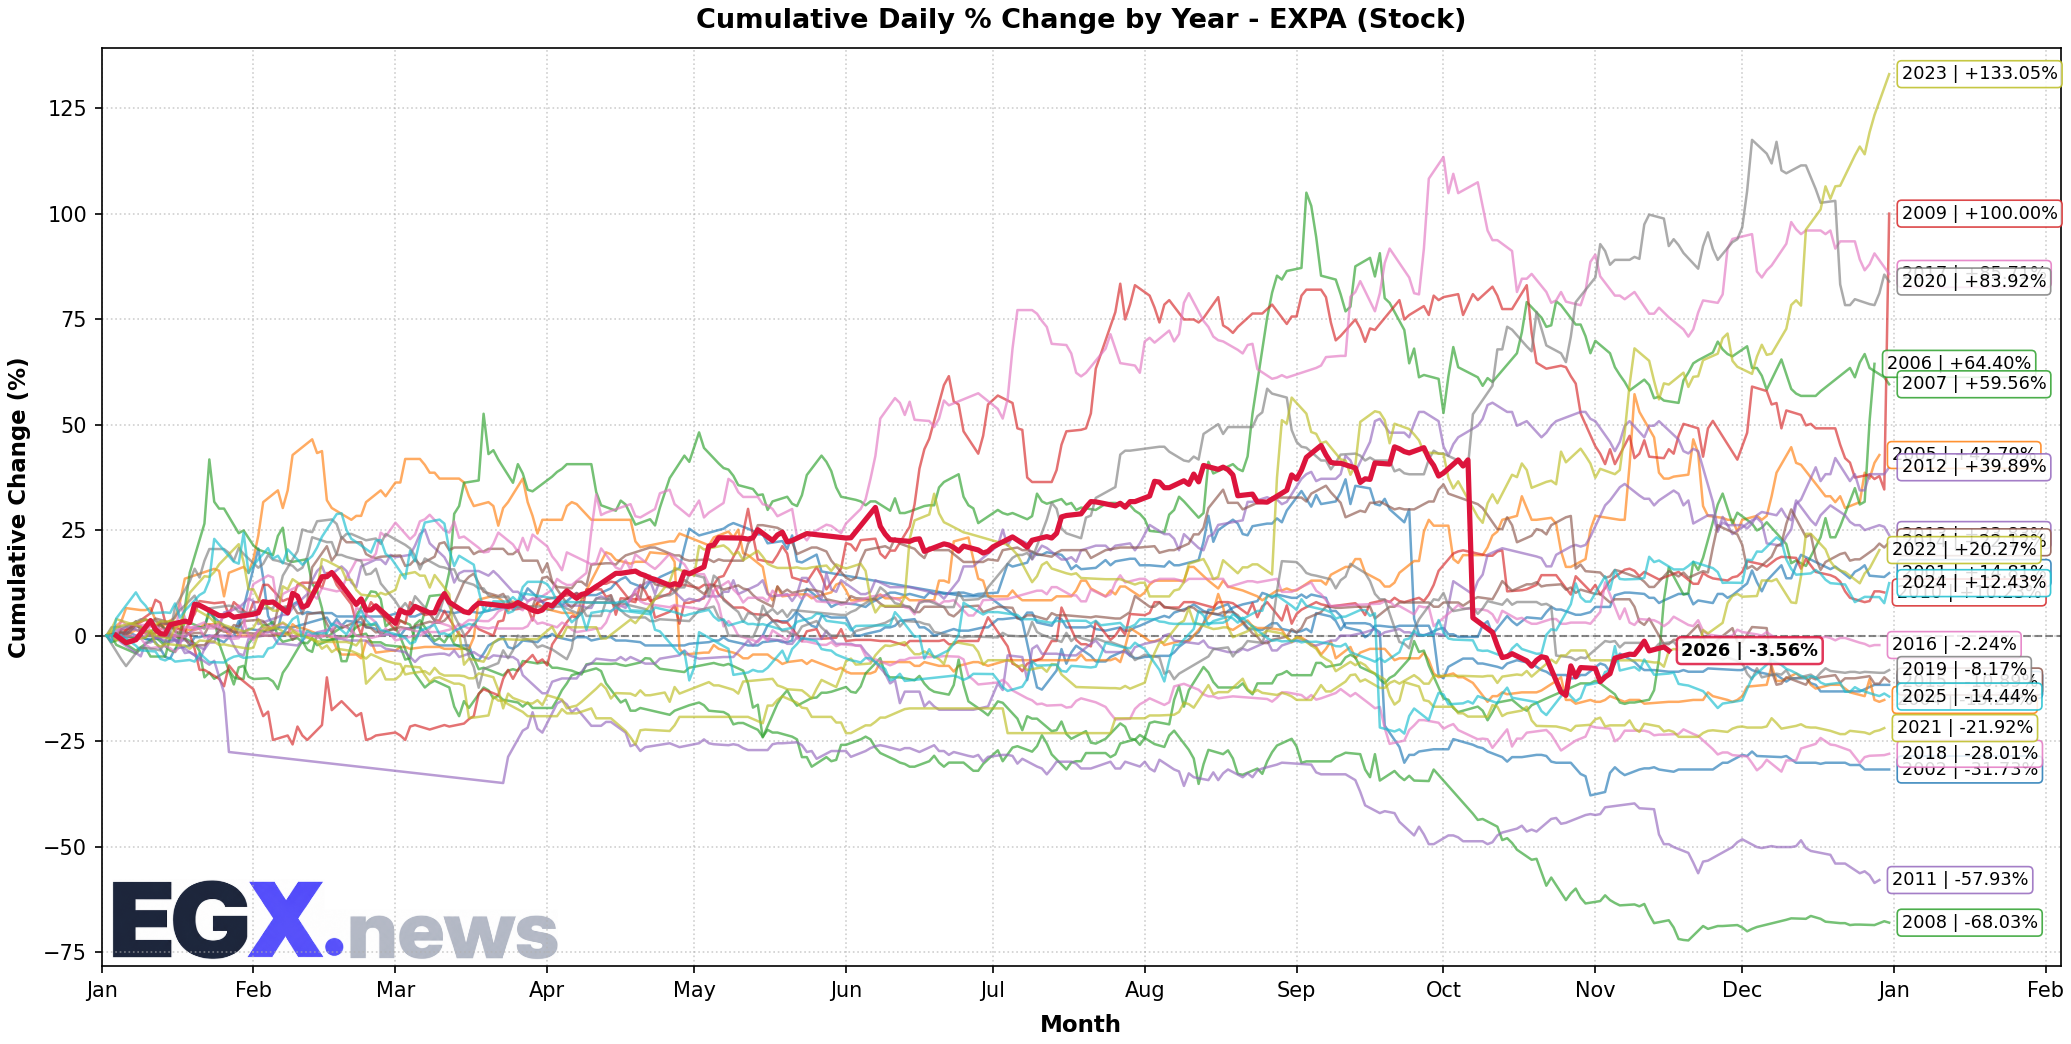
Seasonal Trend & Historical Patterns (EXPA)
Click to EnlargeHistorical monthly seasonal return distribution and performance cycles for EXPA.
Trend Structure & Moving Averages
Trend Score is 30/100 with price trading 3.39% above its 20-day SMA and below the 200-day long-term benchmark (SMA50 is below SMA200).
Momentum, Volume Flow & Volatility
RSI(14) is 43.22 (Neutral), moving +2.77 over the past 5 sessions — indicating a balanced / consolidation posture. MACD line (-0.613) is above signal line (-0.945) with a histogram of +0.332 (Bullish Momentum).
20-day annualized volatility is 51.46%, ATR(14) is 0.66 (4.51% of price), and price is trading in the middle channel (%B: 0.722, Bandwidth: 15.25%).
Statistical Backtests & Historical Win Rates
BacktestedEmpirical backtesting reveals that RSI oversold dips (<30) historically yield an average 20-day return of +0.38% with a 51.49% win rate (101 observations, Reliability: High), while volume spikes yield an average 20-day return of +1.29% (50.48% win rate).
Price sits 34.93% below All-Time High (22.5 set 36 sessions ago on 2026-09-24) and 34.93% below its 52-week high (22.5 on 2026-09-24).