


Cleopatra Hospital
CLHOCleopatra Hospital Company
Company Overview & Activities
1- اقامة مستشفى خاص تحوي سبعين سرير به دور كامل للعيادات الخارجية وقسم الاشعة التشخيصية وقسم للعلاج الطبيعى والصيدليه وذلك بغرض الاتى : أ-تقديم الخدمات الصحية والطبية الحديثة المتطورة ب-توفير العناية والعلاج الطبى للمرضى الذين يفدون اليها . 2- انشاء قسم الاشعة المقطعية 3 – اقامة ملحق للمستشفى باقامة مبنى جديد يضم ثمانون سرير وثلاث حجرات للعمليات وكشك ولاده ووحده تعقيم مركزية اليكترونيه ومركز لحضانات الاطفال يحتوى على عشره حضانات وعيادات خارجية تضم تخصصات جديده مثل عيادة الاسنان ومعمل متكامل حديث وحجرة عمليات صغرى وصيدلية داخلية للمرضى وكافيتريا لخدمة الزوار والمرضى وشراء اجهزة حديثة مثل جهاز اشعة الرنين المغناطيسى وجهاز الجاما كاميرا للتصوير بالنظائر المشعه وجهاز اشعه البانوراما للاسنان وجهاز PCR للتحاليل المؤكدة للفيروسات وجهاز اشعة بالاضافة الى تكييف مركزى وتركيب نظام حريق متكامل .
EGS729J1C018
2016-04-13
FRA Certified Auditor
Financial FAQ & Technical Outlook for Cleopatra Hospital Company (CLHO)
Quantitative Technical Engine (CLHO)
Cleopatra Hospital holds a Bullish technical posture (Overall Score: 61.0/100) with Trend Score 40/100, Momentum Score 80/100 (RSI 47.84 - Neutral), and Volume Score 70/100 (accumulating, 0.41x 20D baseline).
Support & Resistance Confluence Matrix
AlgorithmicNearest support is at 14.05 [Strength: 45.0/100, Tier 3 (Intraday 1-min)] (0.28% below price with a 100.0% confirmed bounce rate across 1 tests, Reliability: Low). Nearest resistance is at 14.14 [Strength: 45.0/100, Tier 3 (Intraday 1-min)] (0.35% above price with a 100.0% confirmed rejection rate across 1 tests, Reliability: Low).
Seasonal Trend & Historical Patterns (CLHO)
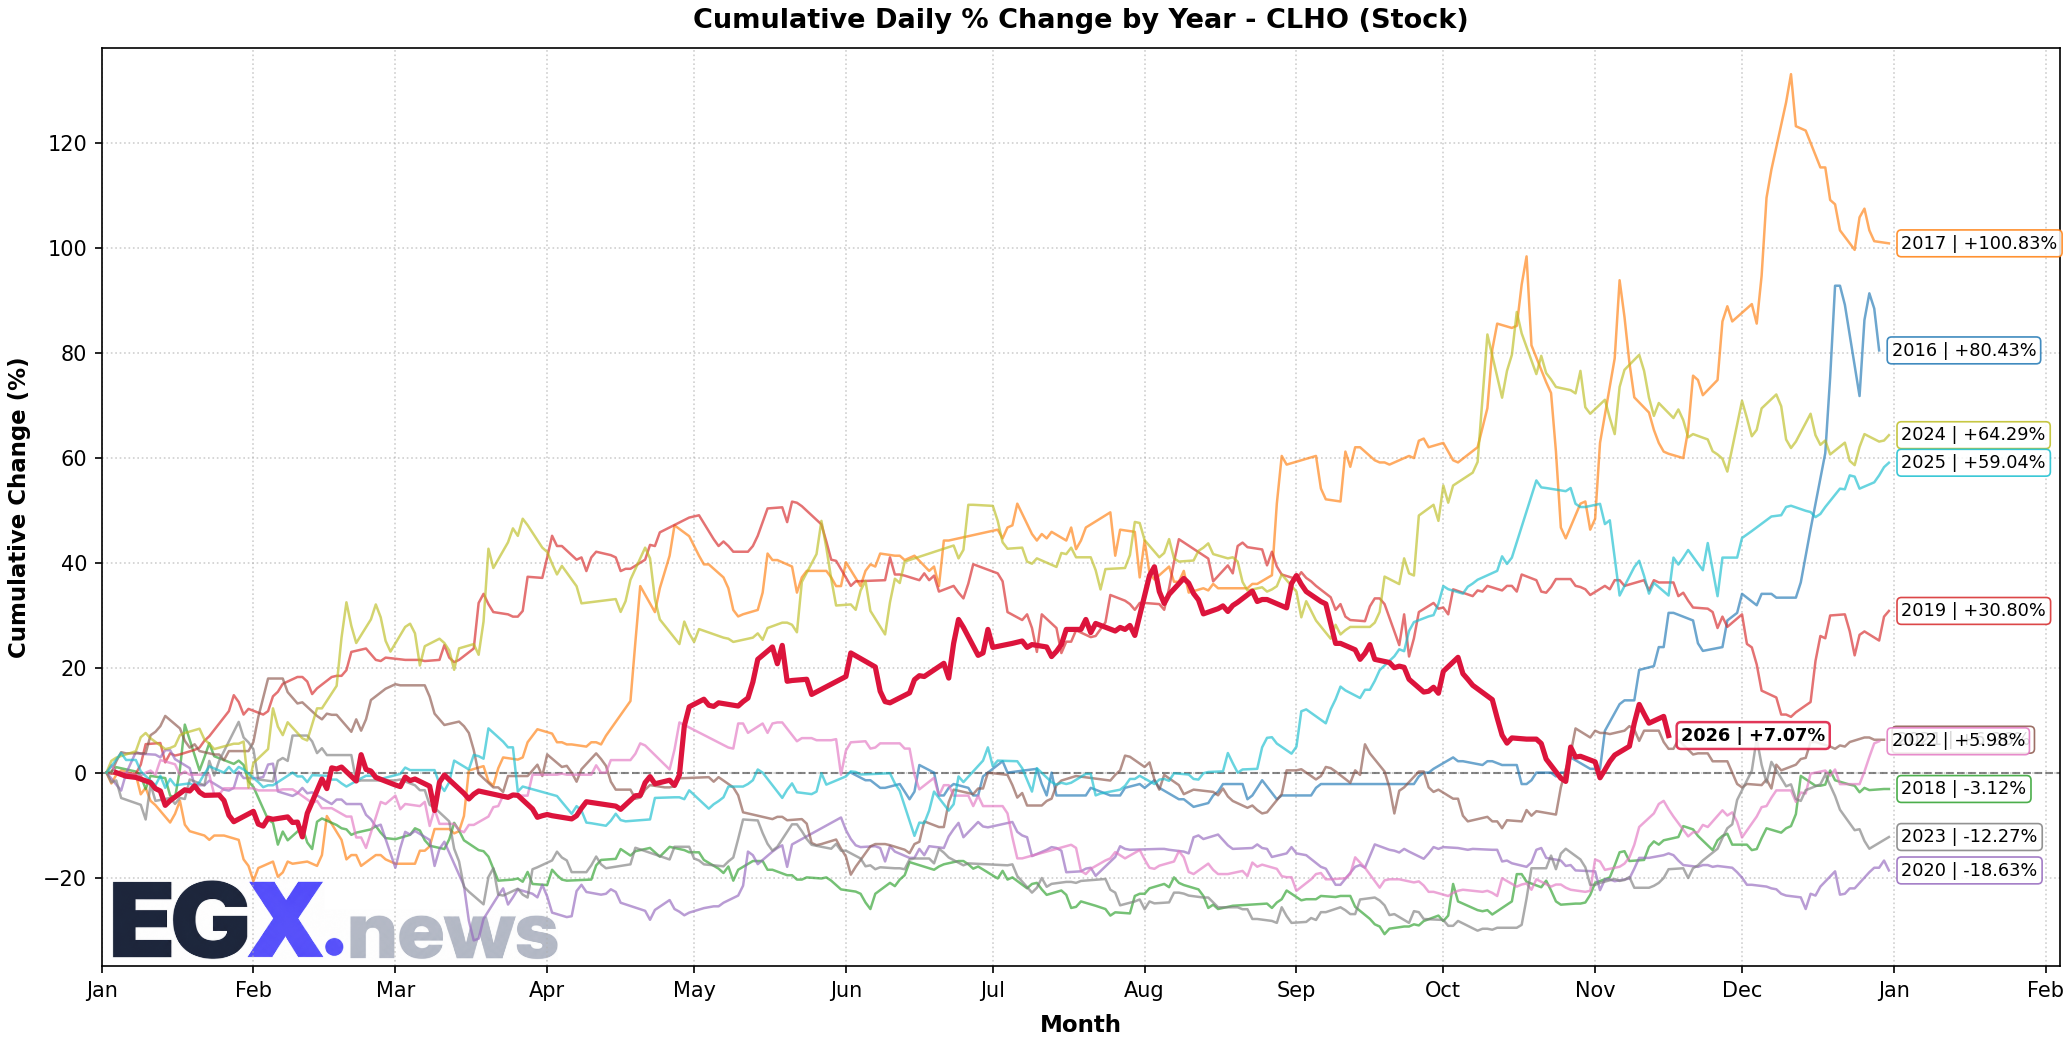
Click to EnlargeHistorical monthly seasonal return distribution and performance cycles for CLHO.
Trend Structure & Moving Averages
Golden Cross (288D)Trend Score is 40/100 with price trading 2.18% above its 20-day SMA and below the 200-day long-term benchmark (SMA50 is above SMA200 for 288 sessions).
Momentum, Volume Flow & Volatility
RSI(14) is 47.84 (Neutral), moving -6.03 over the past 5 sessions — indicating a balanced / consolidation posture. MACD line (-0.088) is above signal line (-0.272) with a histogram of +0.183 (Bullish Momentum).
20-day annualized volatility is 42.05%, ATR(14) is 0.55 (3.9% of price), and price is trading in the middle channel (%B: 0.633, Bandwidth: 16.39%).
Statistical Backtests & Historical Win Rates
BacktestedEmpirical backtesting reveals that RSI oversold dips (<30) historically yield an average 20-day return of +2.68% with a 58.06% win rate (31 observations, Reliability: Moderate), while volume spikes yield an average 20-day return of +2.18% (55.56% win rate).
Price sits 28.55% below All-Time High (19.72 set 73 sessions ago on 2026-08-03) and 28.55% below its 52-week high (19.72 on 2026-08-03).