


Alexandria Mineral Oils
AMOCAlexandria Mineral Oils Co.
Company Overview & Activities
انتاج الزيوت المعدنية الاساسية المتعادلة والنهائية الخاصة ،والزيوت النهائية وتعبئتها وخلطها وانتاج الشموع البرافينية ومنتجاتها ومشتقاتها ،وتعظيم انتاجبة السولار وتحسين درجة انسكابة وخفض نسية الكبريت به، وانتاج المقطرات الشمعية بأنواعها ،و النافتا والبوتاجاز والمازوت ،ووقود الافران ،والكبريت البيولوجى ، وتسويق و بيع كافة هذة المنتجات فى الداخل والخارج ، وتعبئة الزيوت و خلطها لحساب الغير ، وكذلك تكرير الخام لحسابها او لحساب الغير ،وانتاج الديزل والجازولين. وذلك مع مراعاة الاتى:- احكام القوانين واللوائح والقرارات السارية وبشرط استصدار التراخيص اللازمة لممارسة هذة الانشطة . ويجوز للشركة ان تكون لها مصلحة او تشترك باي وجه من الوجوه مع الشركات وغيرها التي تزاول اعمالا شبيهة باعمالها او التي قد تعاونها علي تحقيق غرضها في مصر او في الخارج، كما يجوز لها ان تدمج في الهيئات السالفة او تشتريها او تلحقها بها وذلك طبقا لاحكام القانون ولائحته التنفيذية.
EGS380P1C010
2004-12-22
FRA Certified Auditor
Financial FAQ & Technical Outlook for Alexandria Mineral Oils Co. (AMOC)
Quantitative Technical Engine (AMOC)
Alexandria Mineral Oils holds a Bearish technical posture (Overall Score: 39.0/100) with Trend Score 20/100, Momentum Score 30/100 (RSI 50.28 - Bullish Momentum), and Volume Score 70/100 (accumulating, 0.79x 20D baseline).
Support & Resistance Confluence Matrix
AlgorithmicNearest support is at 13.3 [Strength: 45.0/100, Tier 3 (Intraday 1-min)] (0.45% below price with a 100.0% confirmed bounce rate across 1 tests, Reliability: Low). Nearest resistance is at 13.51 (Volume Profile POC Anchor) [Strength: 60.0/100, Tier 3 (Intraday 1-min)] (1.12% above price with a 100.0% confirmed rejection rate across 1 tests, Reliability: Low).
Seasonal Trend & Historical Patterns (AMOC)
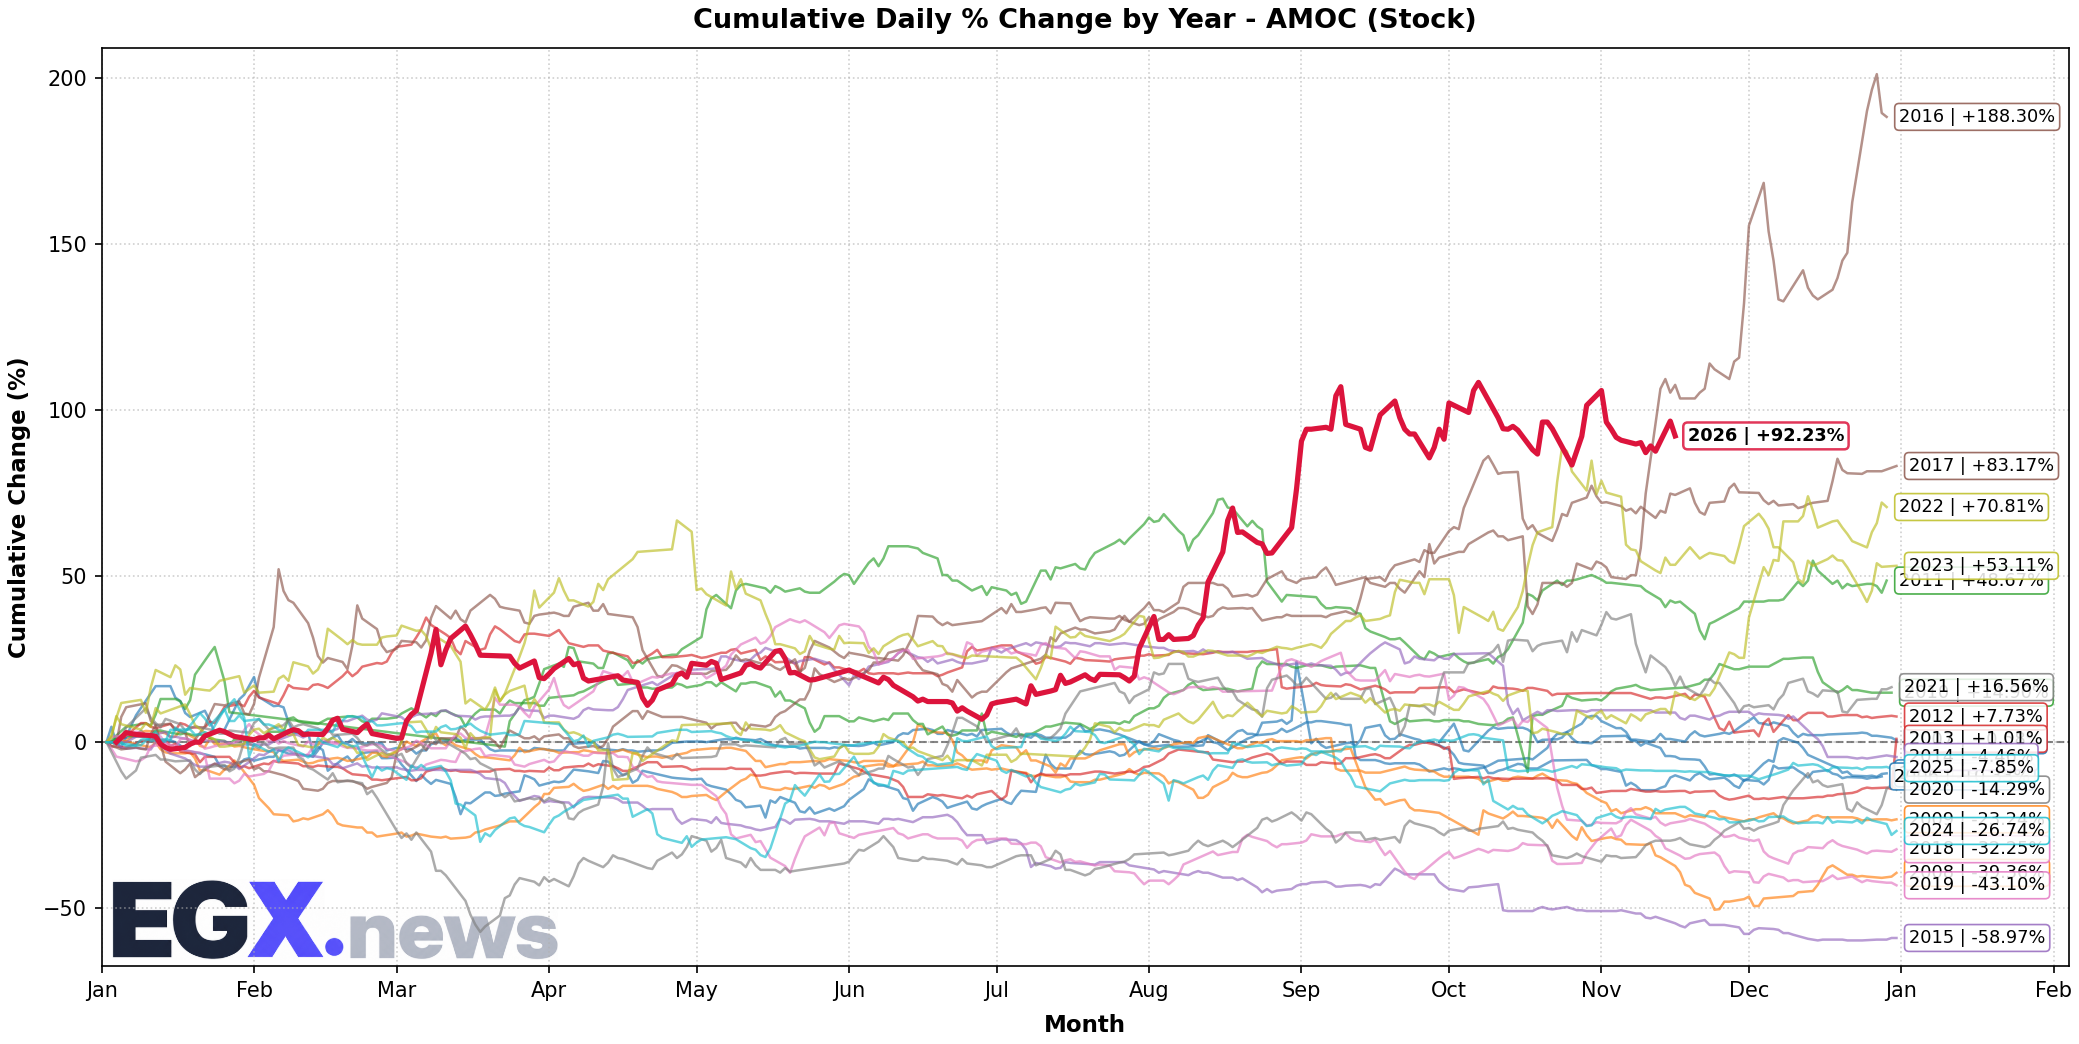
Click to EnlargeHistorical monthly seasonal return distribution and performance cycles for AMOC.
Trend Structure & Moving Averages
Golden Cross (157D)Trend Score is 20/100 with price trading 0.15% below its 20-day SMA and above the 200-day long-term benchmark (SMA50 is above SMA200 for 157 sessions).
Momentum, Volume Flow & Volatility
RSI(14) is 50.28 (Bullish Momentum), moving +2.60 over the past 5 sessions — indicating positive momentum in buyer territory. MACD line (-0.011) is below signal line (0.009) with a histogram of -0.020 (Bearish Momentum).
20-day annualized volatility is 43.7%, ATR(14) is 0.55 (4.12% of price), and price is trading in the middle channel (%B: 0.487, Bandwidth: 11.21%).
Statistical Backtests & Historical Win Rates
BacktestedEmpirical backtesting reveals that RSI oversold dips (<30) historically yield an average 20-day return of +0.83% with a 47.52% win rate (141 observations, Reliability: High), while volume spikes yield an average 20-day return of +0.65% (47.7% win rate).
Price sits 11.82% below All-Time High (15.15 set 11 sessions ago on 2026-11-01) and 11.82% below its 52-week high (15.15 on 2026-11-01).