


Ibnsina Pharma
ISPHIbnsina Pharma
Company Overview & Activities
شراء و بيع و توزيع و تصنيع و تصنيع لدى الغير و تعبئة و تغليف و نقل و تخزين و استيراد و تصدير و امتلاك و القيام بالدعاية التجارية و العلمية و العروض التسويقية التوريدات العمومية و التجارة الاليكترونية لكافة المنتجات الدوائية و البشرية و الحيوية و البيطرية و المستحضرات الشبة الدوائية و الكيماويات و مستحضرات التجميل و الأغذية و المكملات الغذائية و المبيدات و المطهرات بانواعها و الأجهزة الطبية و التعويضية و مستلزمات المعامل و المستشفيات و معدات و أدوات و مواد الكواشف المخبرية و مواد التغليف و الدعاية سواء المصنع منها محليا او المستورد بالإضافة الى امهار المنتجات سالفة الذكر بالاختام و كذلك القيام بالتدريب و الامداد بالمعلومات و برامج النظم و الاستشارات المتعلقة بالمجالات السابق ذكرها و خدمات تاجير و بيع المساحات الإدارية و التخزينية ؛ و يجوز ان تكون لها مصلحة او تشترك باى وجه من الوجوه مع شركات الأموال التي تزاول اعمالا شبيهة لاعمالها او التي قد تعاونها على تحقيق غرضها في مصر او في خارج كما يجوز لها ان تندمج في هذه الشركات او تشتريها او تلحقها بها و ذلك طبقا لاحكام القانون و لائحته التنفي
EGS512O1C012
2017-11-08
FRA Certified Auditor
Financial FAQ & Technical Outlook for Ibnsina Pharma (ISPH)
Quantitative Technical Engine (ISPH)
Ibnsina Pharma holds a Neutral technical posture (Overall Score: 56.8/100) with Trend Score 15/100, Momentum Score 90/100 (RSI 50.49 - Bullish Momentum), and Volume Score 100/100 (accumulating, 1.51x 20D baseline).
Support & Resistance Confluence Matrix
AlgorithmicNearest support is at 10.44 [Strength: 62.7/100, Tier 3 (Intraday 1-min)] (0.85% below price with a 90.9% confirmed bounce rate across 33 tests, Reliability: High). Nearest resistance is at 10.57 [Strength: 45.0/100, Tier 3 (Intraday 1-min)] (0.38% above price with a 100.0% confirmed rejection rate across 1 tests, Reliability: Low).
Seasonal Trend & Historical Patterns (ISPH)
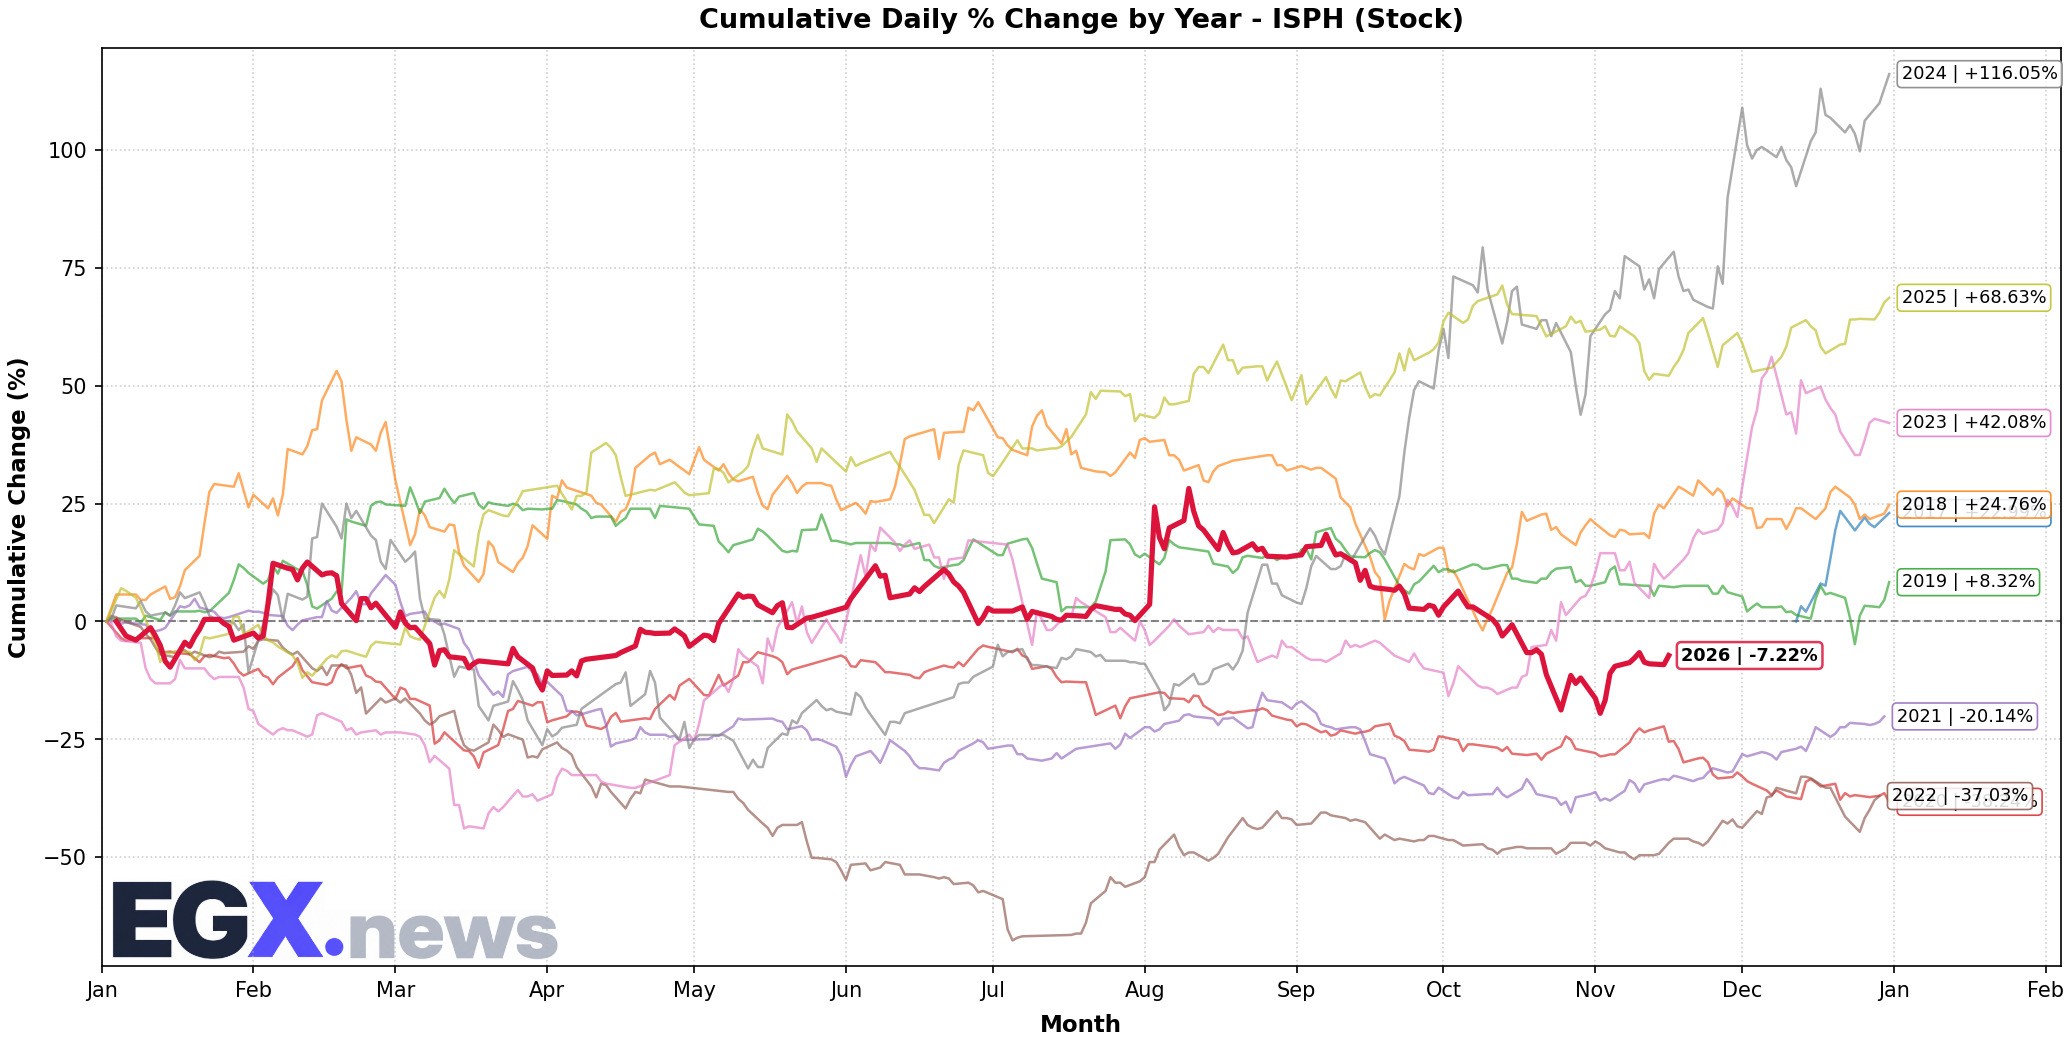
Click to EnlargeHistorical monthly seasonal return distribution and performance cycles for ISPH.
Trend Structure & Moving Averages
Trend Score is 15/100 with price trading 4.57% above its 20-day SMA and below the 200-day long-term benchmark (SMA50 is below SMA200).
Momentum, Volume Flow & Volatility
RSI(14) is 50.49 (Bullish Momentum), moving +1.41 over the past 5 sessions — indicating positive momentum in buyer territory. MACD line (-0.188) is above signal line (-0.332) with a histogram of +0.144 (Bullish Momentum).
20-day annualized volatility is 57.74%, ATR(14) is 0.44 (4.18% of price), and price is trading in the middle channel (%B: 0.743, Bandwidth: 18.57%).
Statistical Backtests & Historical Win Rates
BacktestedEmpirical backtesting reveals that RSI oversold dips (<30) historically yield an average 20-day return of +1.76% with a 42.86% win rate (42 observations, Reliability: Moderate), while volume spikes yield an average 20-day return of +0.97% (45.8% win rate).
Price sits 37.8% below All-Time High (16.93 set 72 sessions ago on 2026-08-04) and 37.8% below its 52-week high (16.93 on 2026-08-04).