


Misr Fertilizers Production Company MOPCO
MFPCMisr Fertilizers Production Company MOPCO
Company Overview & Activities
1-انتاج الأسمدة والامونيا والنيتروجين . 2-شراء وبيع وتسويق جميع منتجات الأسمدة النيتروجينية ومشتقاتها . 3-تنمية وانشاء وامتلاك وتمويل وإدارة وصيانة وتشغيل مشروع لانتاج الملامين ومشتقاته . 4-شراء وبيع وتسويق وتوزيع منتج الملامين ومشتقاته في الخارج وجميع انحاء الجمهورية عدا منطقة شبة جزيرة سيناء فيلزم موافقة الهيئة مسبقاً . 5-انتاج وتوزيع وبيع محلول اليوريا بتركيزات مختلفة ويستخدم في تطبيقات واستخدامات مختلفة ومنها معالجة عادم المحركات ( تحت أسماء تجارية مختلفة ) . وعلى الشركة افراد حسابات مستقلة لكل نشاط على حدة . ويجوز ان يكون للشركة مصلحة او ان تشترك باي وجه من الوجوه في تأسيس او تكوين شركات أخرى تزاول أنشطة مماثلة او شبيهة او مرتبطة بأنشطتها والتي قد تعاونها على تحقيق اغراضها داخل جمهورية مصر العربية وخارجها بعد موافقة الهيئة العامة للاستثمار وعلى الشركة الحصول على كافة التراخيص اللازمة لمباشرة نشاطها
EGS39061C014
2015-03-26
FRA Certified Auditor
Financial FAQ & Technical Outlook for Misr Fertilizers Production Company MOPCO (MFPC)
Quantitative Technical Engine (MFPC)
Misr Fertilizers Production Company MOPCO holds a Bearish technical posture (Overall Score: 32.5/100) with Trend Score 10/100, Momentum Score 20/100 (RSI 40.22 - Neutral), and Volume Score 70/100 (accumulating, 1.12x 20D baseline).
Support & Resistance Confluence Matrix
AlgorithmicNearest support is at 38.8 [Strength: 56.7/100, Tier 3 (Intraday 1-min)] (0.59% below price with a 66.7% confirmed bounce rate across 45 tests, Reliability: High). Nearest resistance is at 39.3 [Strength: 45.0/100, Tier 3 (Intraday 1-min)] (0.69% above price with a 100.0% confirmed rejection rate across 1 tests, Reliability: Low).
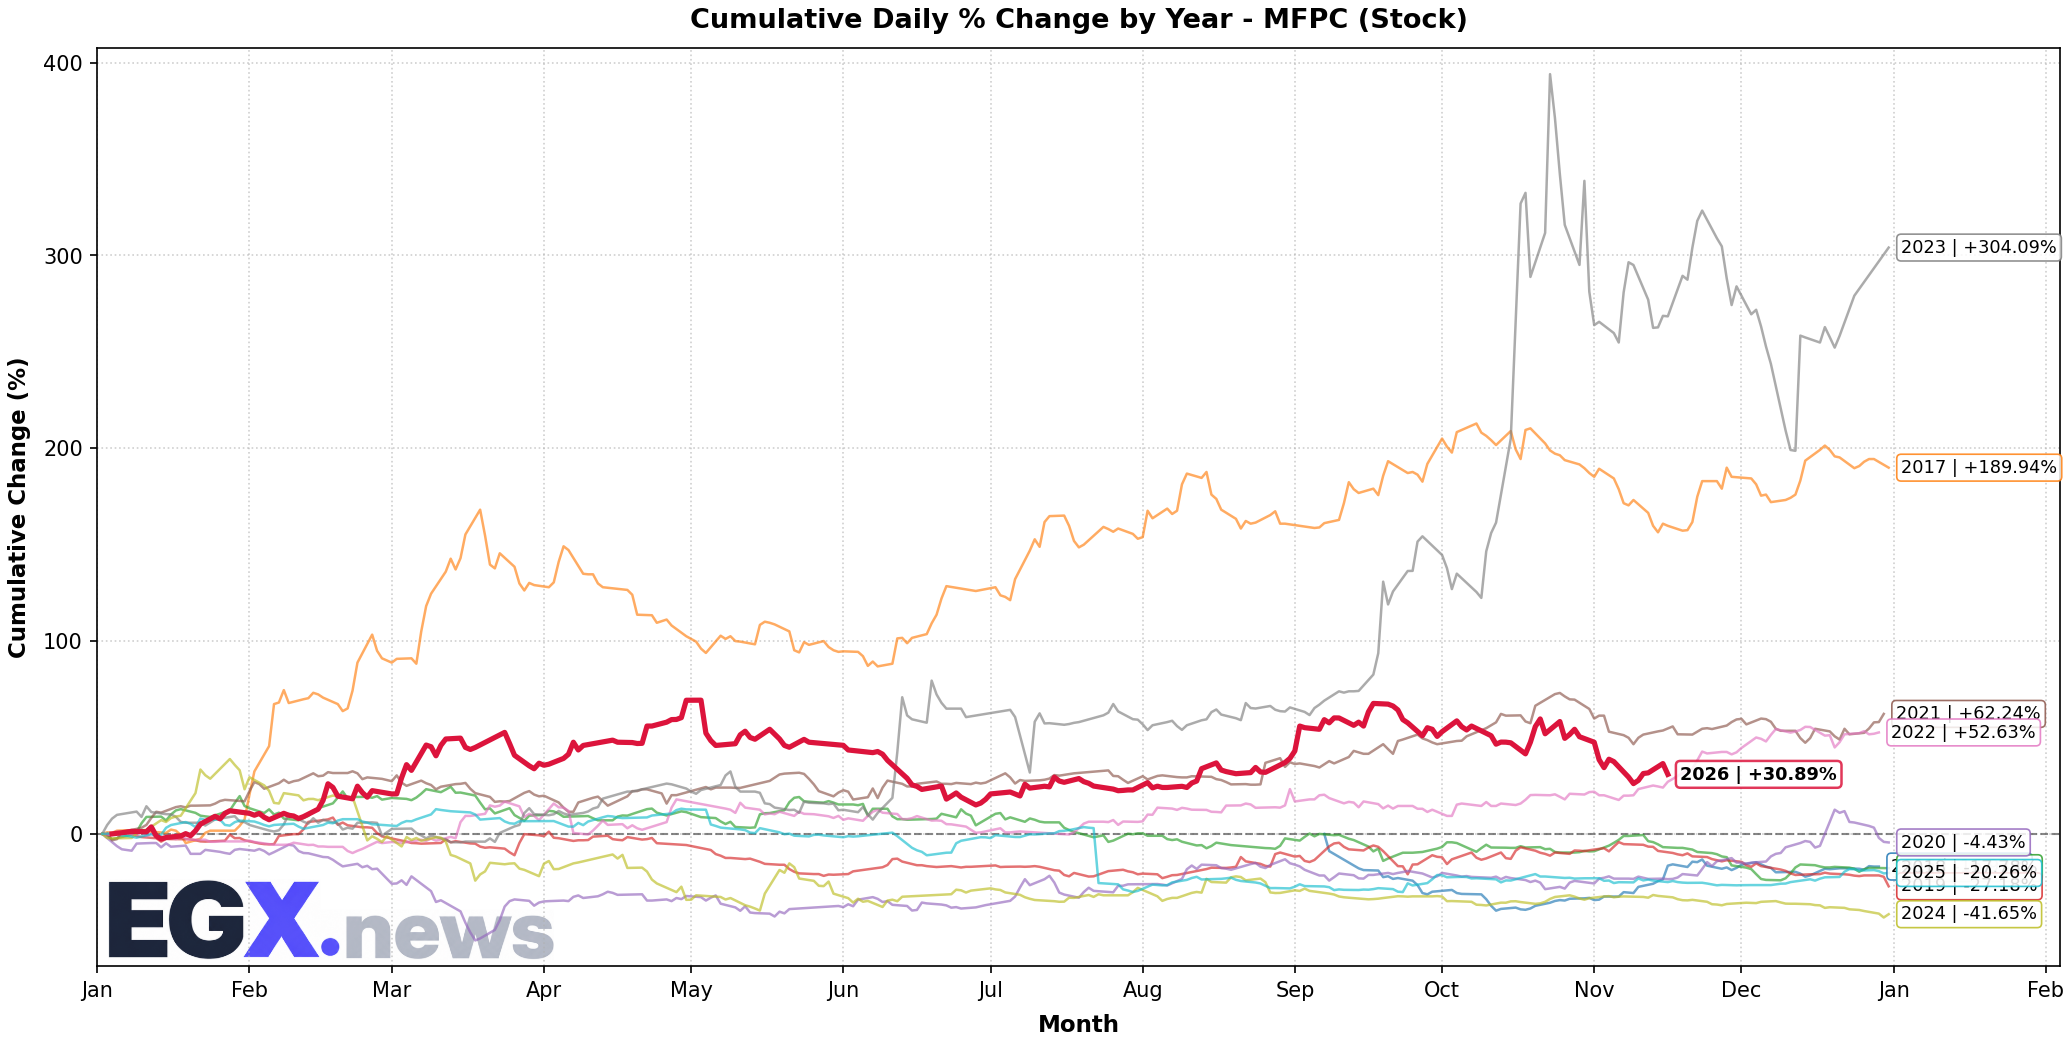
Seasonal Trend & Historical Patterns (MFPC)
Click to EnlargeHistorical monthly seasonal return distribution and performance cycles for MFPC.
Trend Structure & Moving Averages
Golden Cross (165D)Trend Score is 10/100 with price trading 7.88% below its 20-day SMA and below the 200-day long-term benchmark (SMA50 is above SMA200 for 165 sessions).
Momentum, Volume Flow & Volatility
RSI(14) is 40.22 (Neutral), moving +7.36 over the past 5 sessions — indicating a balanced / consolidation posture. MACD line (-1.626) is below signal line (-1.397) with a histogram of -0.228 (Bearish Momentum).
20-day annualized volatility is 58.2%, ATR(14) is 2.0 (5.12% of price), and price is trading in the middle channel (%B: 0.249, Bandwidth: 31.32%).
Statistical Backtests & Historical Win Rates
BacktestedEmpirical backtesting reveals that RSI oversold dips (<30) historically yield an average 20-day return of +1.83% with a 53.33% win rate (45 observations, Reliability: Moderate), while volume spikes yield an average 20-day return of +4.58% (54.37% win rate).
Price sits 56.27% below All-Time High (89.26 set 723 sessions ago on 2023-10-24) and 24.94% below its 52-week high (52.0 on 2026-05-03).