


Egypt Aluminum
EGALEgypt Aluminum
Company Overview & Activities
انشاء مصانع فى مصر لانتاج الالومنيوم ومنتجات التشييد الاخرى و تشمل مصنوعات الالومنيوم معدات البناء و المنتجات الصناعية و الاستهلاكية المصنوعة من المسبوكات و المطروقات والالواح والرقائق الألومنيوم وتصنيع الخامات المختلفة المكملة من الحديد – خشب بلاستيك وتصنيع مستلزمات صناعة الألومنيوم من فورم واسطمبات ونماذج وما الى ذلك والقيام باستيراد وتصدير كل مايتعلق بغرض الشركة المذكورة وتصنيع وإنتاج الاكسسوار بغرض البيع في السوق المحلى والتصدير للخارج وتصنيع كافة منتجات الألومنيوم ولوازمة من شيابيك وابواب وخلافه وكافة مايلزم وكذلك الاستثمار في الأوراق المالية وكذلك الاستثمار العقارى سواء بيع وشراء وتاجير واستئجار الاراضى والعقارات ويجوز للشركة ان تكون لها مصلحة او تشترك باى وجه من الوجوه مع الشركات وغيرها، التى تزاول اعمالا شبيهة باعمالها او التى قد تعاونها على تحقيق غرضها فى مصر او فى الخارج كما يجوز لها ان تندمج في الهيئات السالفة او تشتريها او تلحقها بها وذلك طبقا لاحكام القانون وبموافقة الهيئة العامة للاستثمار والمناطق الحرة .
EGS3E181C010
1997-07-29
FRA Certified Auditor
Financial FAQ & Technical Outlook for Egypt Aluminum (EGAL)
Quantitative Technical Engine (EGAL)
Egypt Aluminum holds a Bullish technical posture (Overall Score: 66.0/100) with Trend Score 50/100, Momentum Score 100/100 (RSI 56.59 - Bullish Momentum), and Volume Score 70/100 (accumulating, 1.28x 20D baseline).
Support & Resistance Confluence Matrix
AlgorithmicNearest support is at 324.51 [Strength: 45.0/100, Tier 3 (Intraday 1-min)] (0.76% below price with a 100.0% confirmed bounce rate across 1 tests, Reliability: Low). Nearest resistance is at 328.5 [Strength: 61.4/100, Tier 3 (Intraday 1-min)] (0.46% above price with a 85.7% confirmed rejection rate across 28 tests, Reliability: High).
Seasonal Trend & Historical Patterns (EGAL)
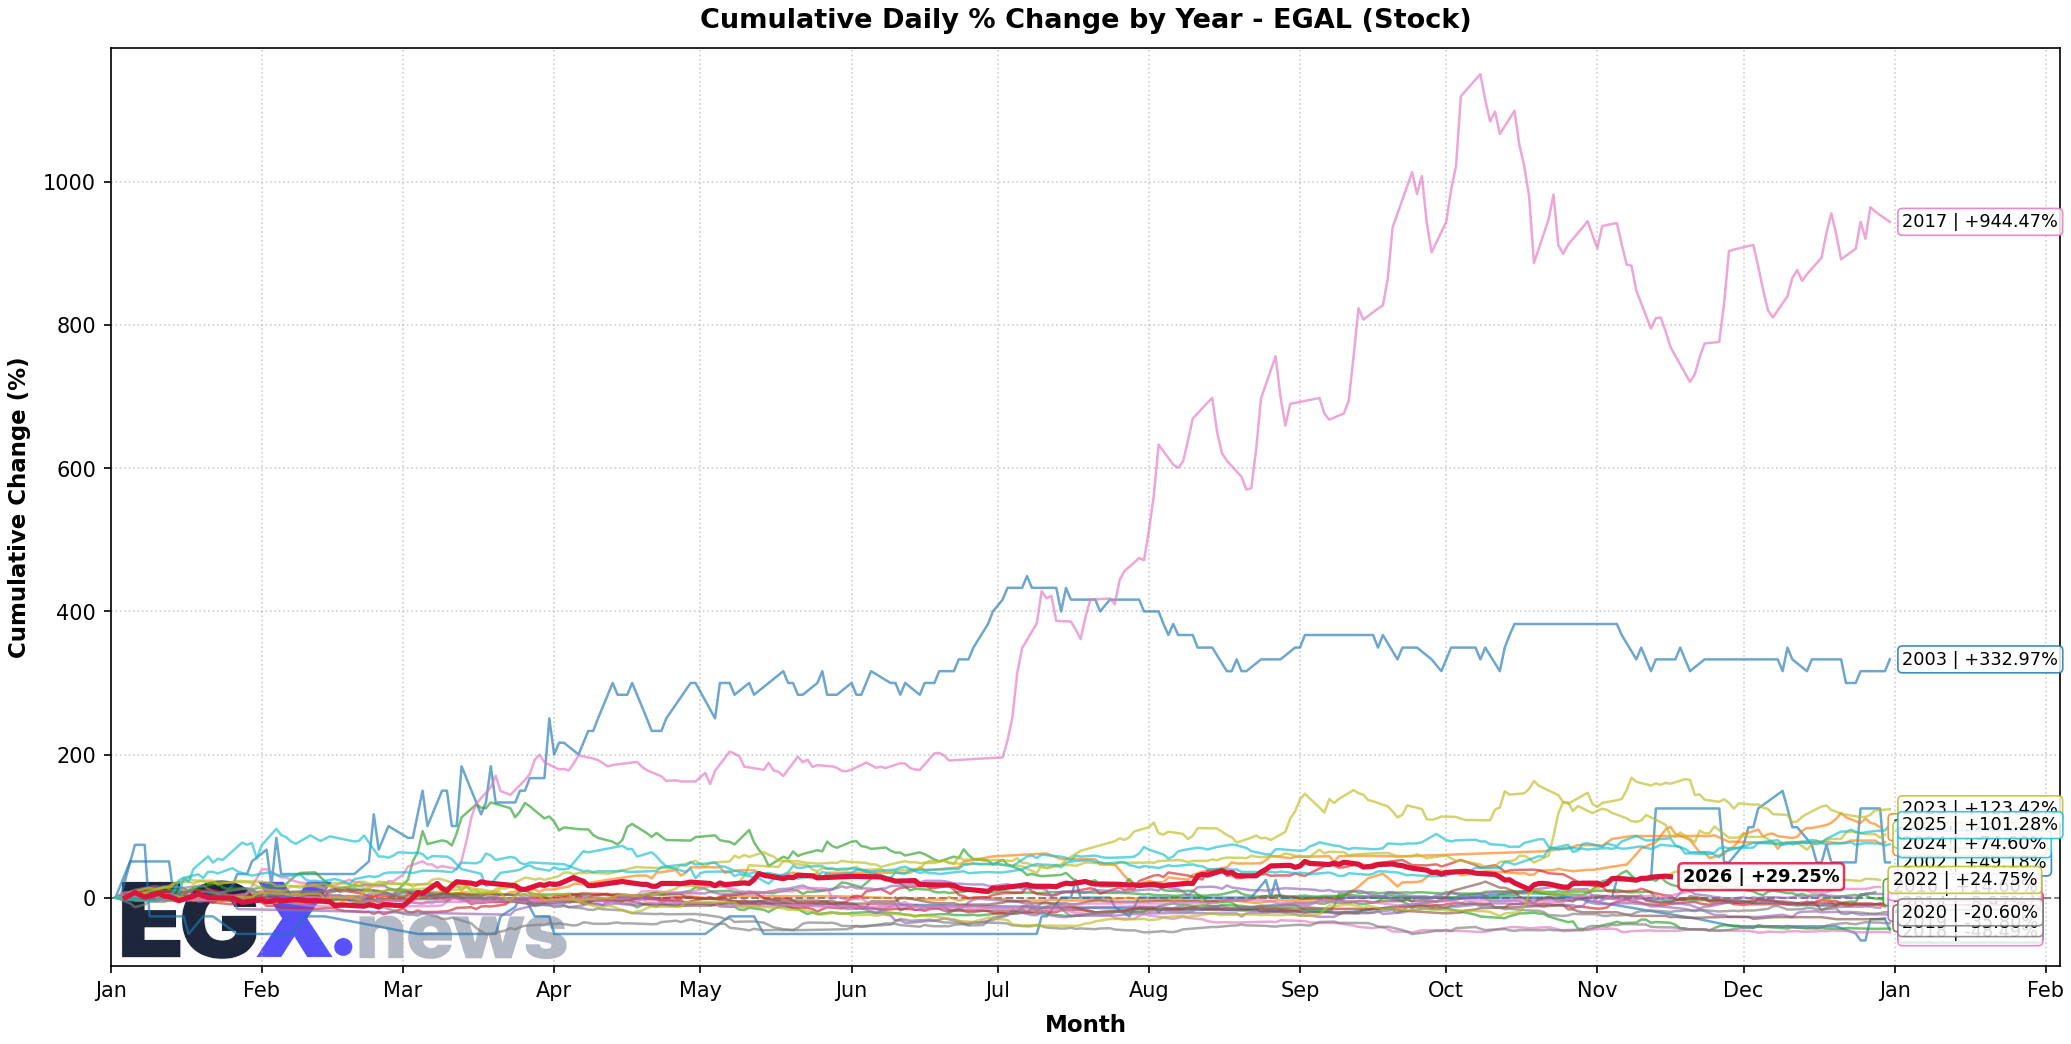
Click to EnlargeHistorical monthly seasonal return distribution and performance cycles for EGAL.
Trend Structure & Moving Averages
Golden Cross (959D)Trend Score is 50/100 with price trading 5.51% above its 20-day SMA and above the 200-day long-term benchmark (SMA50 is above SMA200 for 959 sessions).
Momentum, Volume Flow & Volatility
RSI(14) is 56.59 (Bullish Momentum), moving +7.48 over the past 5 sessions — indicating positive momentum in buyer territory. MACD line (0.444) is above signal line (-3.566) with a histogram of +4.010 (Bullish Momentum).
20-day annualized volatility is 33.36%, ATR(14) is 10.27 (3.14% of price), and price is trading near the upper band (%B: 0.855, Bandwidth: 15.52%).
Statistical Backtests & Historical Win Rates
BacktestedEmpirical backtesting reveals that RSI oversold dips (<30) historically yield an average 20-day return of -0.77% with a 47.78% win rate (90 observations, Reliability: Good), while volume spikes yield an average 20-day return of +6.06% (53.53% win rate).
Price sits 17.22% below All-Time High (395.0 set 52 sessions ago on 2026-09-02) and 17.22% below its 52-week high (395.0 on 2026-09-02).