


Egypt Gas
EGASEgypt Gas Co.
Company Overview & Activities
القيام بتنفيذ مشروعات الغاز الطبيعى و انشاء و تشغيل و إدارة و تملك خطوط و منشآت و مرافق و نظمة الغاز و كافة المعدات وفقا ىلاحكام القانون و للشركة القيام بكافة الاعمال المرتبطة بتلك الأنشطة بما في ذلك ما يلى :- •عمليات التركيب و التوصيات الخارجية و الداخلية و اعمال التحويلات الأجهزة للعمل بالغاز الطبيعى و المداخن في المساكن و المصانع و محطات الوقى و كافة المنشآت و ما يستلزم ذلك من انشاءات شبكات توزيع و ملحقاتها و محطات تخفيض الضغط و القياس . •تنفيذ جميع الدراسات الفنية و الاقتصادية و المسح الميدانى و الرسومات الفنية المتعلقة بتطوير و استخدام الغاز الطبيعى . •توفير المعدات و المهمات و الأجهزة المطلوبة . •عمليات الصيانة و صلاح و تصنيع الأجهزة المستخدمة والازمة للغاز الطبيعى . •تنفيذ اى اعمال خاصة بالغاز الطبيعى . •متابعة وصيانة و اصلاح شبكات الغاز الطبيعى و ملحقاتها و محطات التحكم و تخفيض الضغط و كافة التوصيلات . •للشركة استغلال إمكانيات و طاقات الشركة المتاحة في تقديم خدماتها للغير داخل قطاع البترول او خاجه بشرط الا يؤثر ذلك على طبيعة نشاط الشركة . •تصنيع الأجهزة التي تعم
EGS39011C019
1992-04-07
FRA Certified Auditor
Financial FAQ & Technical Outlook for Egypt Gas Co. (EGAS)
Quantitative Technical Engine (EGAS)
Egypt Gas holds a Neutral technical posture (Overall Score: 59.2/100) with Trend Score 35/100, Momentum Score 80/100 (RSI 49.46 - Neutral), and Volume Score 70/100 (accumulating, 0.81x 20D baseline).
Support & Resistance Confluence Matrix
AlgorithmicNearest support is at 49.19 [Strength: 45.0/100, Tier 3 (Intraday 1-min)] (1.56% below price with a 100.0% confirmed bounce rate across 1 tests, Reliability: Low). Nearest resistance is at 50.87 [Strength: 45.0/100, Tier 3 (Intraday 1-min)] (1.8% above price with a 100.0% confirmed rejection rate across 1 tests, Reliability: Low).
Seasonal Trend & Historical Patterns (EGAS)
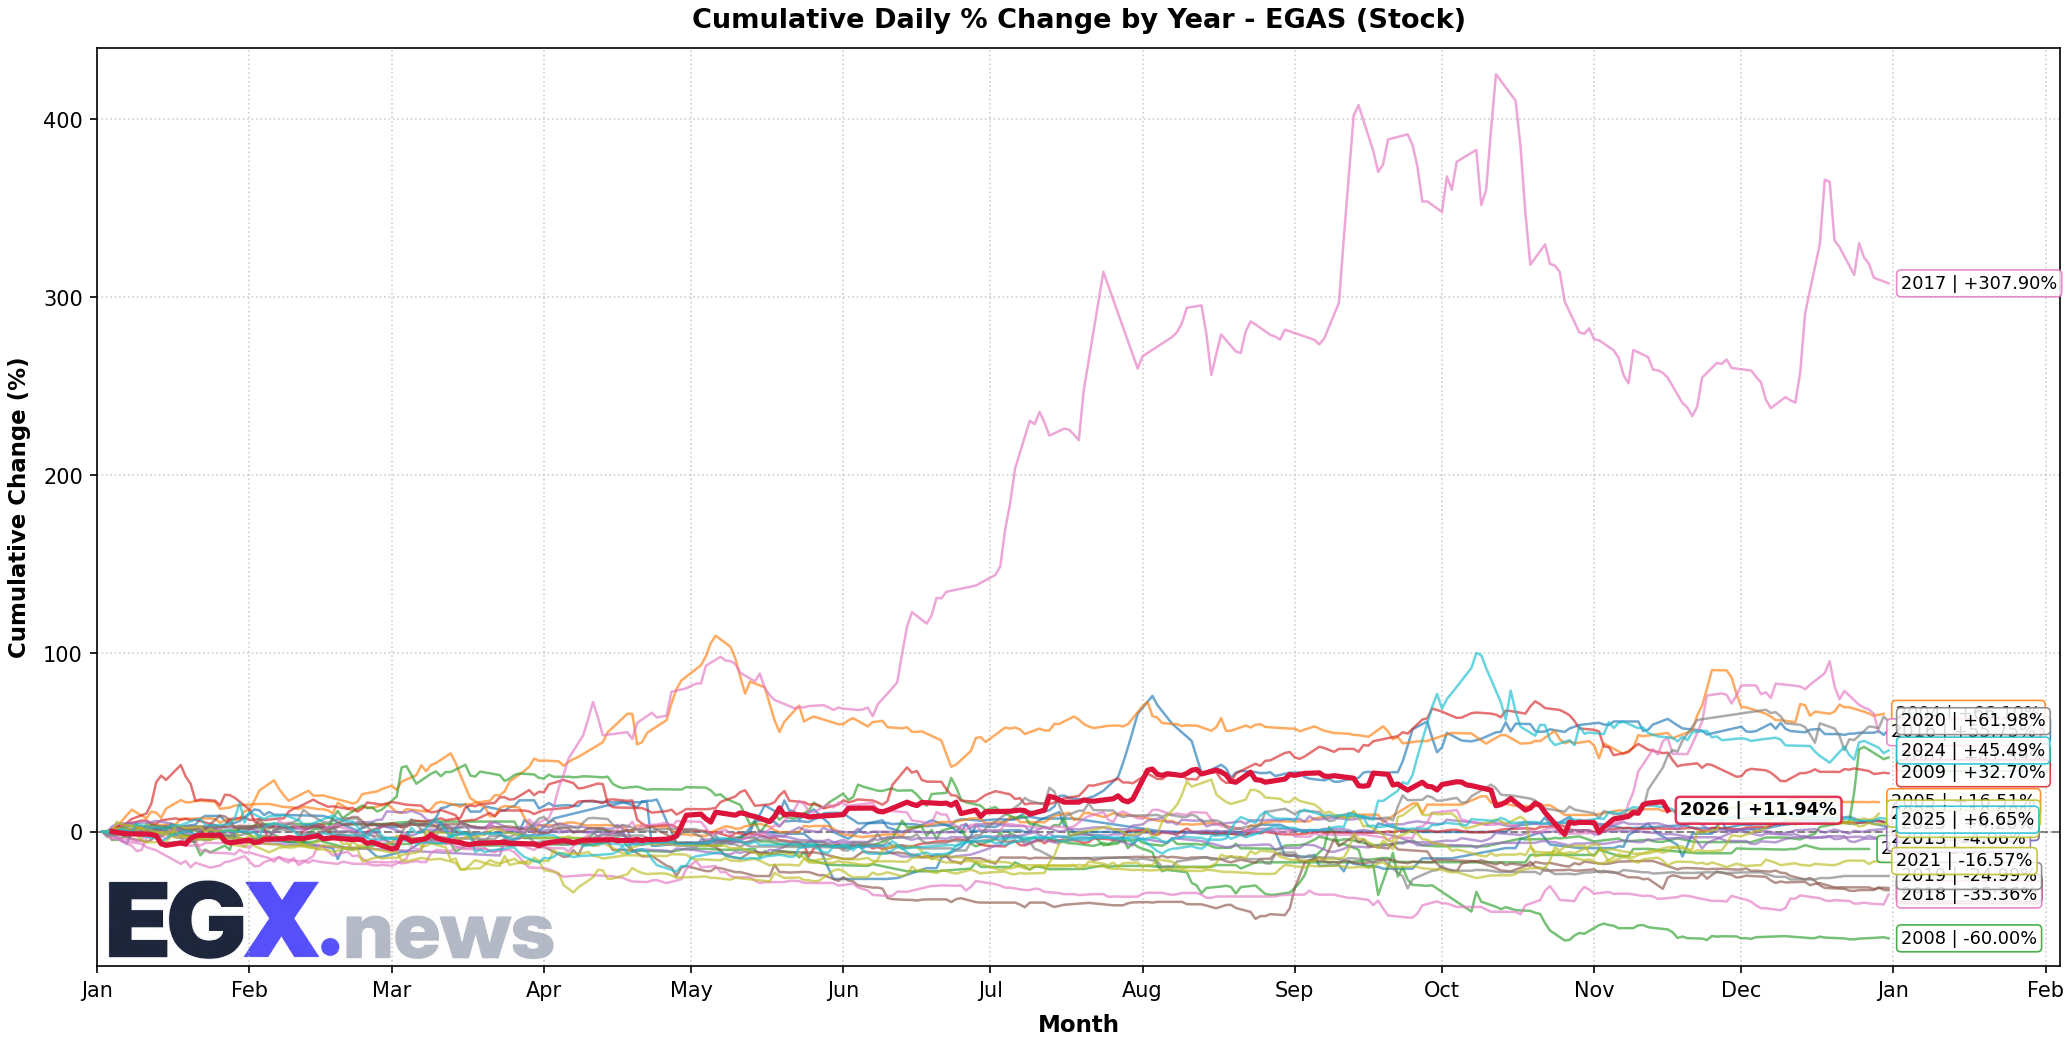
Click to EnlargeHistorical monthly seasonal return distribution and performance cycles for EGAS.
Trend Structure & Moving Averages
Golden Cross (121D)Trend Score is 35/100 with price trading 3.46% above its 20-day SMA and above the 200-day long-term benchmark (SMA50 is above SMA200 for 121 sessions).
Momentum, Volume Flow & Volatility
RSI(14) is 49.46 (Neutral), moving +0.73 over the past 5 sessions — indicating a balanced / consolidation posture. MACD line (-0.447) is above signal line (-1.252) with a histogram of +0.804 (Bullish Momentum).
20-day annualized volatility is 56.44%, ATR(14) is 2.88 (5.76% of price), and price is trading in the middle channel (%B: 0.663, Bandwidth: 21.1%).
Statistical Backtests & Historical Win Rates
BacktestedEmpirical backtesting reveals that RSI oversold dips (<30) historically yield an average 20-day return of +5.02% with a 68.24% win rate (85 observations, Reliability: Good), while volume spikes yield an average 20-day return of +1.96% (50.53% win rate).
Price sits 26.19% below All-Time High (67.7 set 73 sessions ago on 2026-08-03) and 26.19% below its 52-week high (67.7 on 2026-08-03).