


Cairo
CIRACairo For Investment And Real Estate Developments -CIRA Education
Company Overview & Activities
إنشاء وتأسيس وتأثيث وإدارة منشأت تعليمية (في حدود القوانين والقرارات السارية في هذا الشأن) وإسكان إداري وإسكان دون المتوسط ومنشأت علاجية وتجارة الأدوات الطبية وأجهزة المستشفيات وخدمات بترولية وبيع وشراء وتقسيم الأراضي مع مراعاة أحكام القانون (143) لسنة 1981 والتصدير والنقل بمختلف أنواعه وشحن البضائع وبيع وشراء الشقق السكنية والوحدات الإدارية والعقارات كل ذلك بما لا يخالف قرار وزير الاقتصاد والتجارة الخارجية رقم (204) لسنة 1991 وإقامة المنشأت العقارية والمقاولات العمومية الخاصة والمتخصصة وإنشاء وتجهيز وإدارة وإعادة تأهيل الأندية والمراكز الرياضية والاجتماعية بهدف تنمية المواهب الرياضية وبما تشمله تلك الأندية والمراكز من ملاعب ومنشأت رياضية أخرى والمراكز الترفيهية وفقاً للقوانين المطبقة. ويجوز للشركة أن تكون لها مصلحة أو تشترك بأي وجه من الوجوه مع الشركات وغيرها التي تزاول أعمالا شبيهة بأعمالها أو التي قد تعاونها على تحقيق غرضها في مصر أو في الخارج، كما يجوز لها أن تندمج في الهيئات السالفة أو تشتريها أو تلحقها بها وذلك طبقاً لأحكام القانون ولائحته التنفيذية.
EGS65541C012
2018-09-03
FRA Certified Auditor
Financial FAQ & Technical Outlook for Cairo For Investment And Real Estate Developments -CIRA Education (CIRA)
Quantitative Technical Engine (CIRA)
Cairo holds a Very Bullish technical posture (Overall Score: 91.5/100) with Trend Score 80/100, Momentum Score 100/100 (RSI 62.09 - Strong Bullish Momentum), and Volume Score 100/100 (accumulating, 4.47x 20D baseline).
Support & Resistance Confluence Matrix
AlgorithmicNearest support is at 39.36 (Volume Profile POC Anchor) [Strength: 60.0/100, Tier 3 (Intraday 1-min)] (0.35% below price with a 100.0% confirmed bounce rate across 1 tests, Reliability: Low). Nearest resistance is at 39.89 [Strength: 45.0/100, Tier 3 (Intraday 1-min)] (0.99% above price with a 100.0% confirmed rejection rate across 1 tests, Reliability: Low).
Seasonal Trend & Historical Patterns (CIRA)
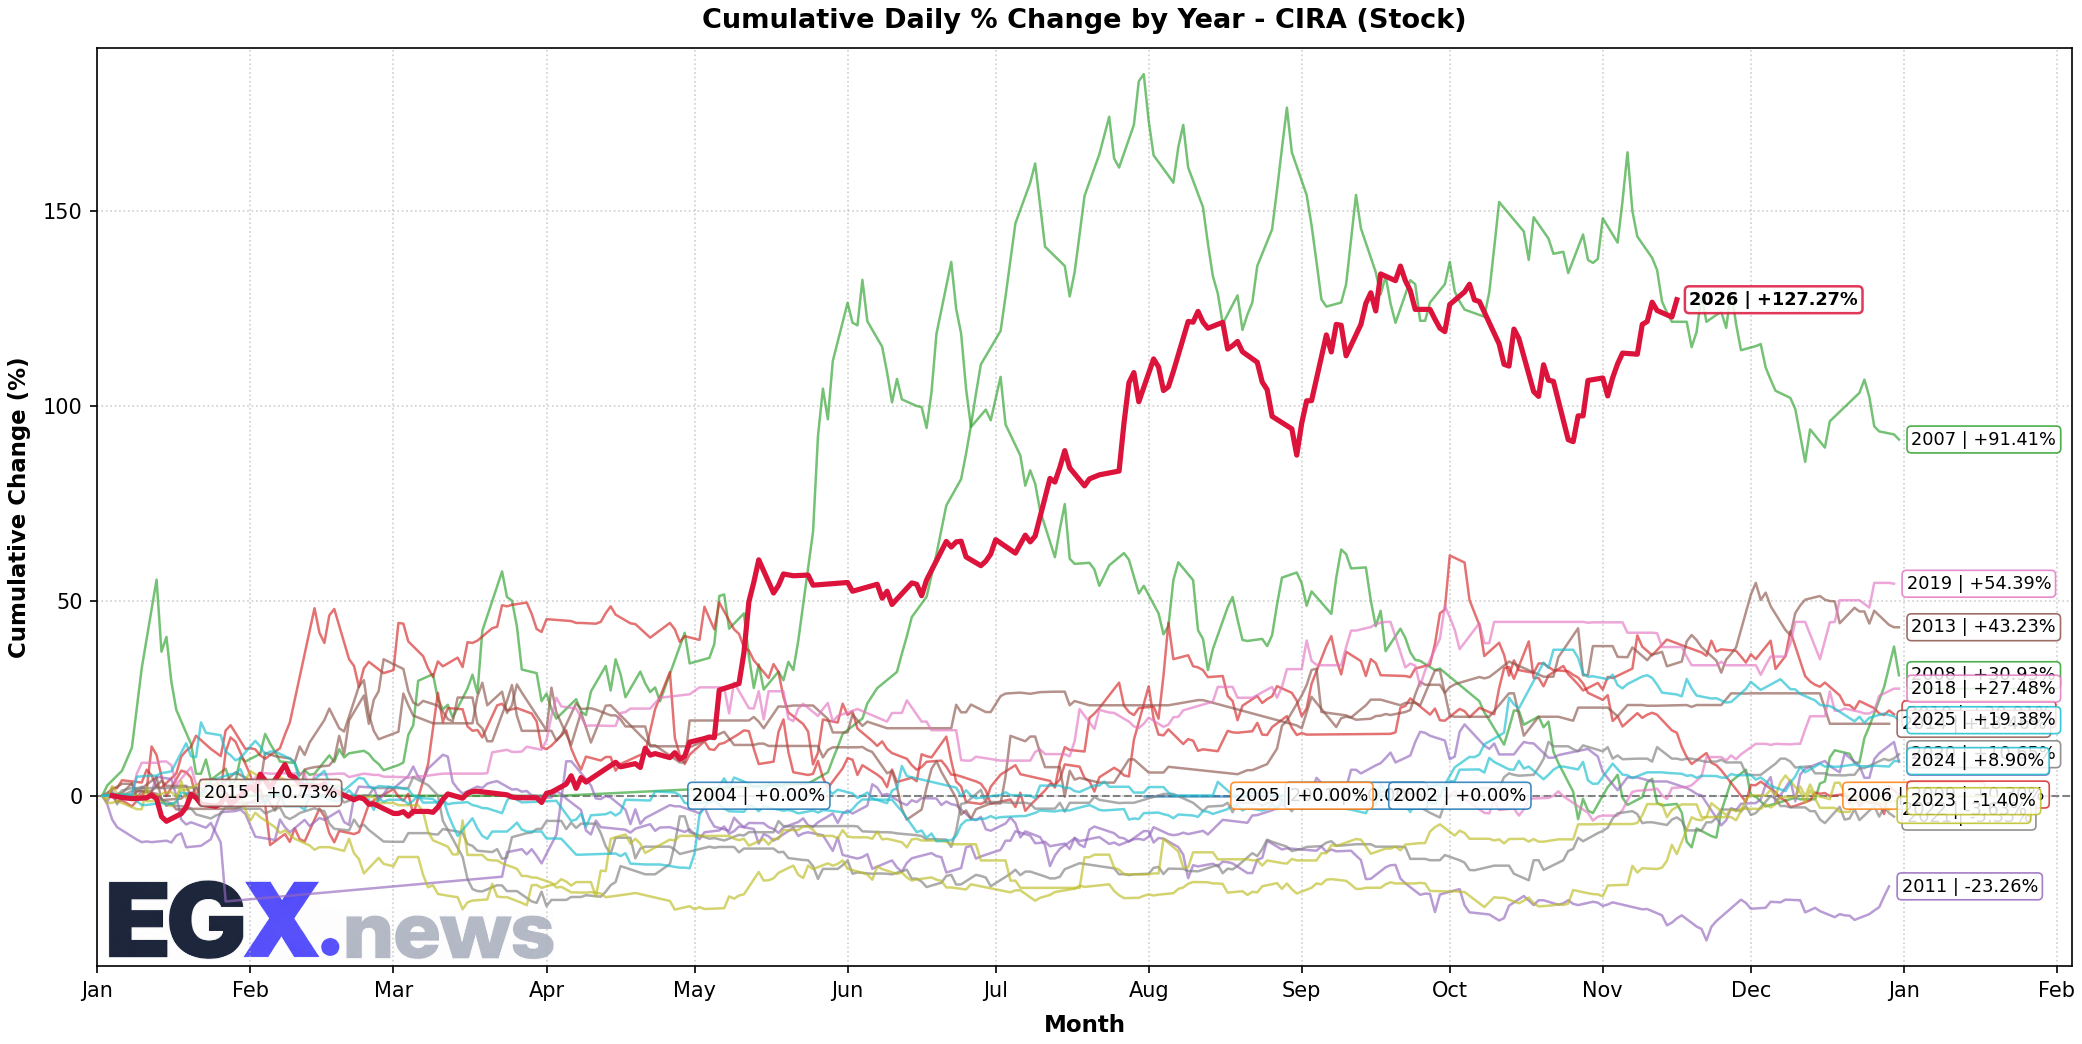
Click to EnlargeHistorical monthly seasonal return distribution and performance cycles for CIRA.
Trend Structure & Moving Averages
Golden Cross (254D)Trend Score is 80/100 with price trading 8.07% above its 20-day SMA and above the 200-day long-term benchmark (SMA50 is above SMA200 for 254 sessions).
Momentum, Volume Flow & Volatility
RSI(14) is 62.09 (Strong Bullish Momentum), moving +3.03 over the past 5 sessions — confirming powerful bullish upward pressure. MACD line (0.579) is above signal line (0.113) with a histogram of +0.466 (Bullish Momentum).
20-day annualized volatility is 42.52%, ATR(14) is 1.83 (4.63% of price), and price is trading near the upper band (%B: 0.88, Bandwidth: 21.23%).
Statistical Backtests & Historical Win Rates
BacktestedEmpirical backtesting reveals that RSI oversold dips (<30) historically yield an average 20-day return of +8.02% with a 74.14% win rate (58 observations, Reliability: Good), while volume spikes yield an average 20-day return of +3.10% (60.84% win rate).
Price sits 5.37% below All-Time High (41.74 set 44 sessions ago on 2026-09-14) and 5.37% below its 52-week high (41.74 on 2026-09-14).