


GB Corp
GBCOGB Corp
Company Overview & Activities
تجارة وتوزيع وتسويق جميع وسائل النقل بما فى ذلك النقل الثقيل والنصف نقل وسيارات الركوب والاتوبيسات والمينى باص والميكروباص والجرارات الزراعية والاوناش والالات الميكانيكية ومعدات البناء وتحريك التربة والموتورات بمختلف اشكالها و انواعها المصنعة محليا و المستوردة الجديد منها و المستعمل و الاتجار فى قطع غيارها و لوازمها المصنعة محليا و المستوردة و الاتجار فى اطارات وسائل النقل و المعدات بجميع انواعها المصنعة محليا و المستوردة و التصدير و بيع جميع المنتجات والبضائع المستوردة والمحلية بالنقد او بالاجل والتأجير التمويلى .
EGS673T1C012
2007-03-07
FRA Certified Auditor
Financial FAQ & Technical Outlook for GB Corp (GBCO)
Quantitative Technical Engine (GBCO)
GB Corp holds a Bearish technical posture (Overall Score: 39.5/100) with Trend Score 0/100, Momentum Score 70/100 (RSI 37.01 - Bearish Momentum), and Volume Score 70/100 (accumulating, 0.77x 20D baseline).
Support & Resistance Confluence Matrix
AlgorithmicNearest support is at 22.6 [Strength: 45.0/100, Tier 3 (Intraday 1-min)] (1.44% below price with a 100.0% confirmed bounce rate across 1 tests, Reliability: Low). Nearest resistance is at 23.08 [Strength: 45.0/100, Tier 3 (Intraday 1-min)] (0.65% above price with a 100.0% confirmed rejection rate across 1 tests, Reliability: Low).
Seasonal Trend & Historical Patterns (GBCO)
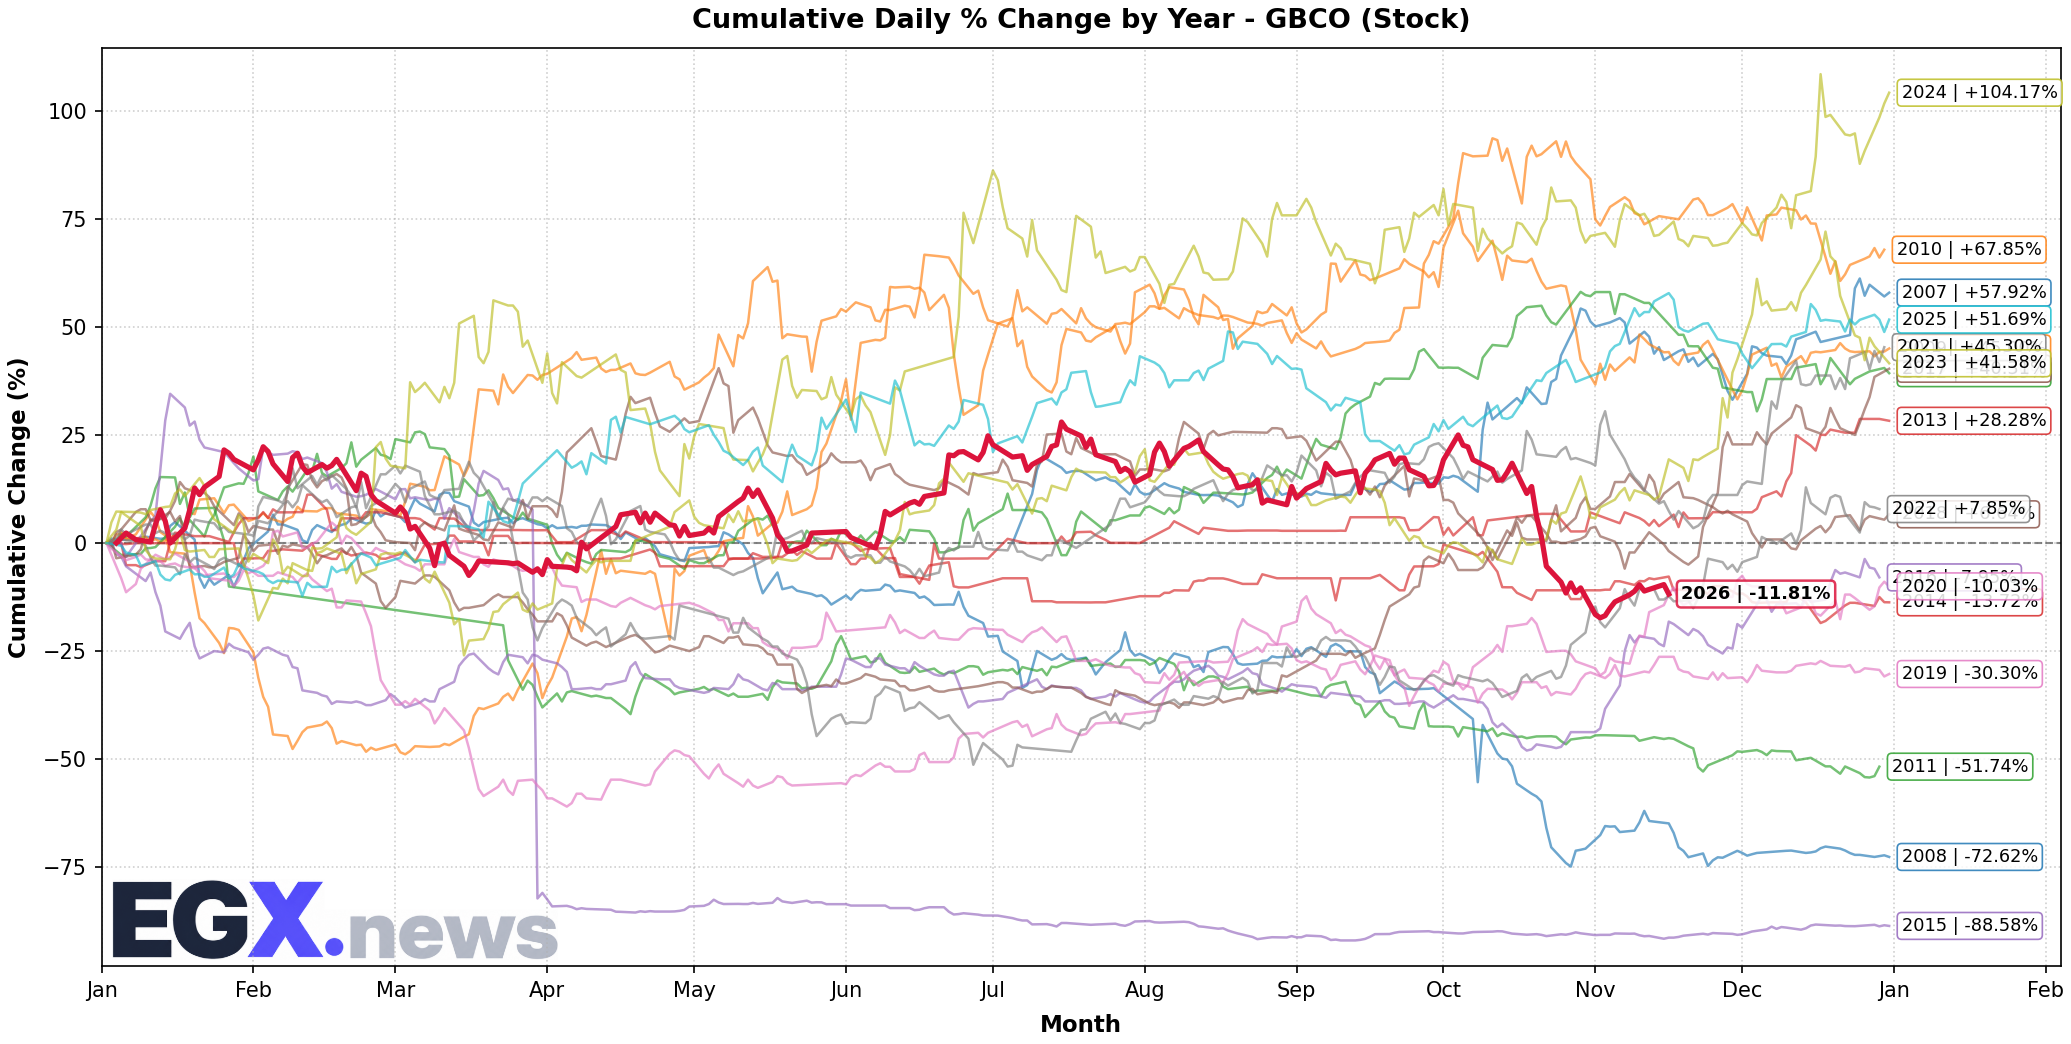
Click to EnlargeHistorical monthly seasonal return distribution and performance cycles for GBCO.
Trend Structure & Moving Averages
Trend Score is 0/100 with price trading 1.76% below its 20-day SMA and below the 200-day long-term benchmark (SMA50 is below SMA200).
Momentum, Volume Flow & Volatility
RSI(14) is 37.01 (Bearish Momentum), moving +1.38 over the past 5 sessions — reflecting persistent selling pressure. MACD line (-1.368) is above signal line (-1.66) with a histogram of +0.292 (Bullish Momentum).
20-day annualized volatility is 49.52%, ATR(14) is 1.05 (4.58% of price), and price is trading in the middle channel (%B: 0.431, Bandwidth: 25.24%).
Statistical Backtests & Historical Win Rates
BacktestedEmpirical backtesting reveals that RSI oversold dips (<30) historically yield an average 20-day return of -1.28% with a 46.46% win rate (99 observations, Reliability: Good), while volume spikes yield an average 20-day return of +0.36% (49.24% win rate).
Price sits 67.24% below All-Time High (70.0 set 4372 sessions ago on 2008-03-10) and 32.95% below its 52-week high (34.2 on 2026-07-15).