


Al
KRDIAl Khair River for Development Agriculture Investment and Environmental Services
Company Overview & Activities
- استصلاح و تجهيز الاراضى بالمرافق الأساسية التي تجعلها قابلة للاستزراع - استزراع الأراضي المستصلحة (في حدود خمسة عشر الف فدان ). - و يشترط في هاتين الحالتين ان تكون الأراضي مخصصة لأغراض الاستصلاح و الاستزراع ، وان تستخدم طرق الري الحديثة و ليس الري بطريق الغمر . - فيما عدا المناطق الصادر بها قرار رئيس الوزراء رقم 350 لسنة 2007 ومراعاة قرار رئيس جمهورية مصر العربية رقم 356 لسنة 2008 . - تربية جميع أنواع الحيوانات سواء كان ذالك لانتاج السلالات أو الألبان أو التسمين أو اللحوم. - تربية جميع أنواع الدواجن والطيور سواء كان ذالك لانتاج السلالات أو التفريخ أو انتاج البيض أو التسمين أو اللحوم. - تقديم خدمات النظافة وتجميع القمامة (دون تدويرها) مع التزام الشركة بافراد حسابات مستقلة ومركز مالى مستقل لكل نشاط على حدة مع مراعاه أحكام القوانين واللوائح والقرارات السارية وبشرط استصدار التراخيص اللازمة لممارسة هذه الأنشطة. - إقامة وتشغيل الأسواق والمجمعات التسويقية ومنافذ البيع والتوزيع المحلى لكافة المنتجات الزراعية والريفية (خضر – فاكهة – محاصيل – انتاج حيوانى – دواجن سمكى – منتجات الصناعا
EGS02291C010
2021-12-30
FRA Certified Auditor
Financial FAQ & Technical Outlook for Al Khair River for Development Agriculture Investment and Environmental Services (KRDI)
Quantitative Technical Engine (KRDI)
Al holds a Bearish technical posture (Overall Score: 32.5/100) with Trend Score 0/100, Momentum Score 70/100 (RSI 39.49 - Bearish Momentum), and Volume Score 35/100 (distributing, 0.66x 20D baseline).
Support & Resistance Confluence Matrix
AlgorithmicNearest support is at 0.34 [Strength: 85.0/100, Tier 1 (Macro 500D)] (2.86% below price with a 100.0% confirmed bounce rate across 28 tests, Reliability: High). Nearest resistance is at 0.36 [Strength: 84.1/100, Tier 1 (Macro 500D)] (2.86% above price with a 96.4% confirmed rejection rate across 28 tests, Reliability: High).
Seasonal Trend & Historical Patterns (KRDI)
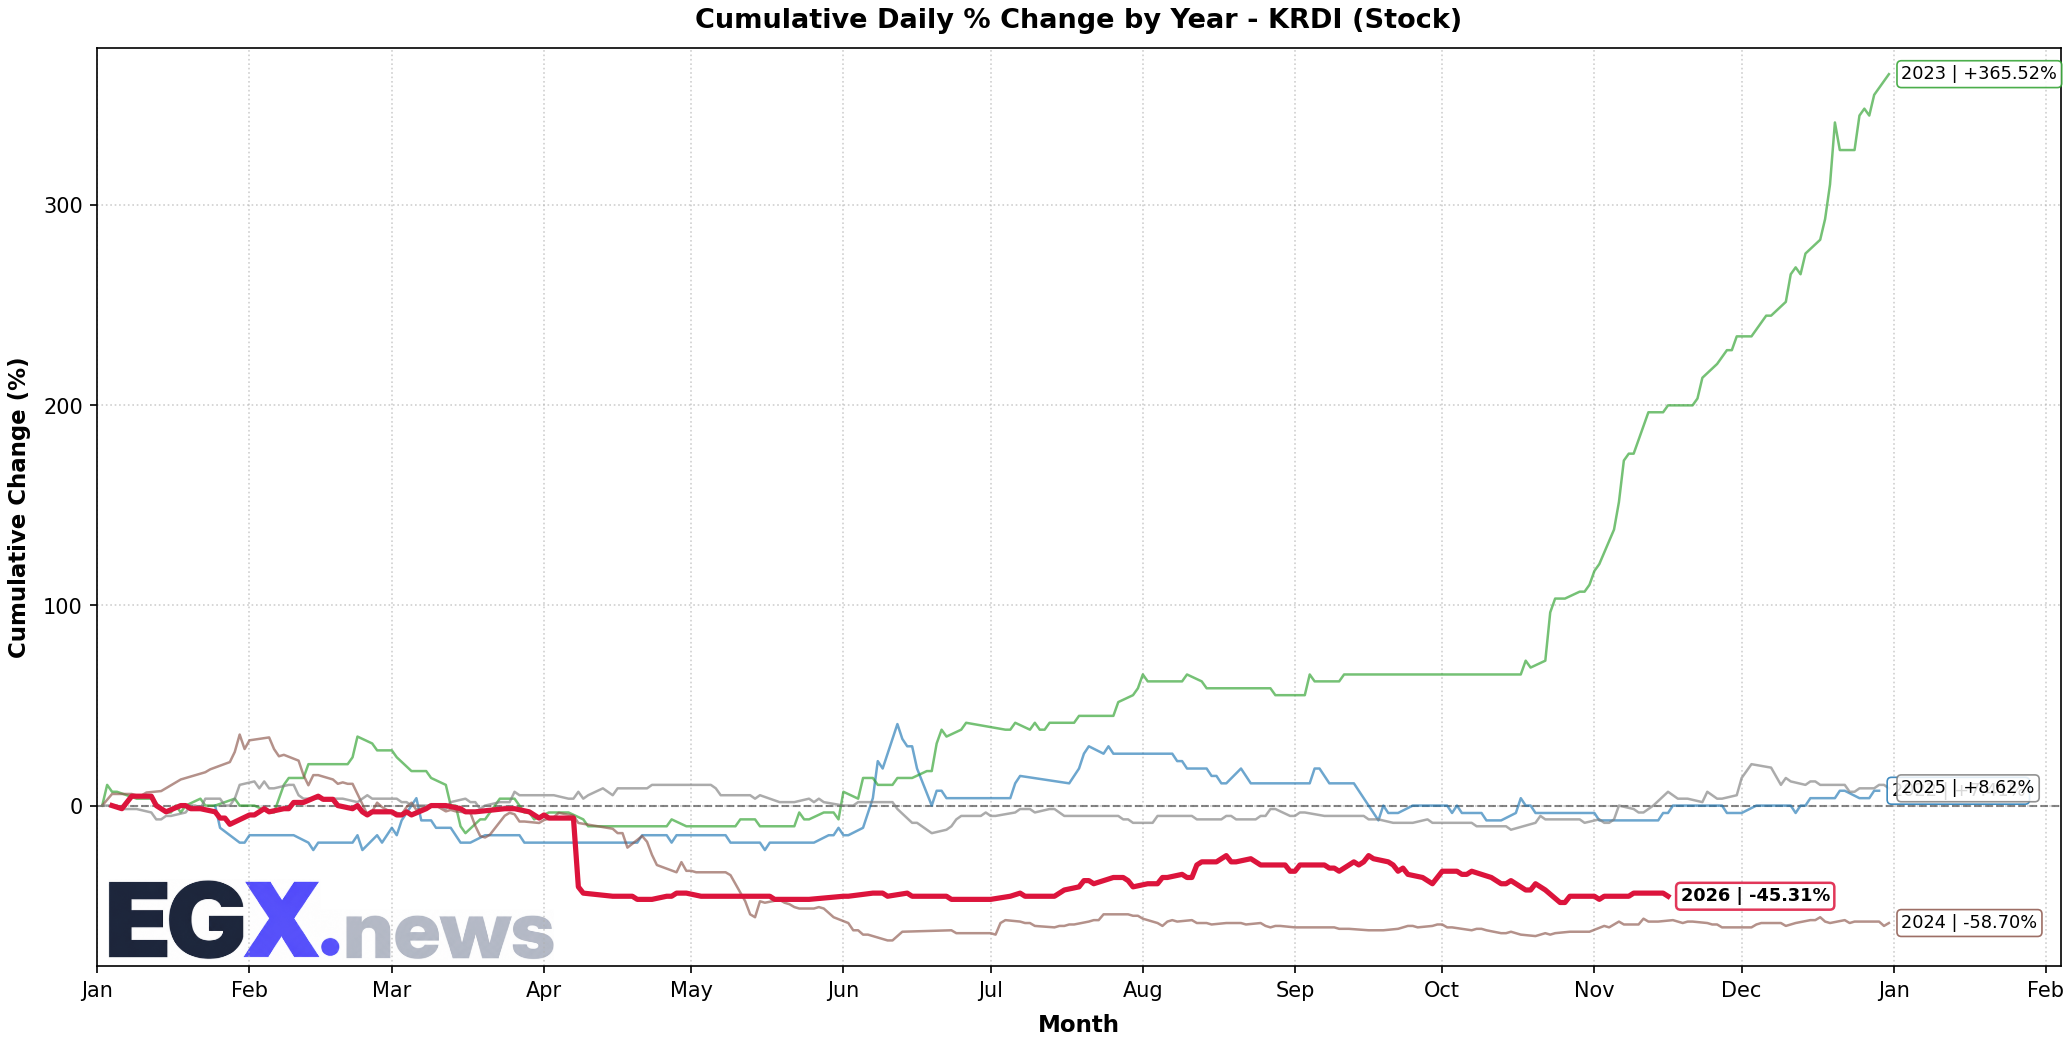
Click to EnlargeHistorical monthly seasonal return distribution and performance cycles for KRDI.
Trend Structure & Moving Averages
Trend Score is 0/100 with price trading 0.0% above its 20-day SMA and below the 200-day long-term benchmark (SMA50 is below SMA200).
Momentum, Volume Flow & Volatility
RSI(14) is 39.49 (Bearish Momentum), moving -4.90 over the past 5 sessions — reflecting persistent selling pressure. MACD line (-0.01) is above signal line (-0.014) with a histogram of +0.003 (Bullish Momentum).
20-day annualized volatility is 55.0%, ATR(14) is 0.02 (5.71% of price), and price is trading in the middle channel (%B: 0.4, Bandwidth: 14.29%).
Statistical Backtests & Historical Win Rates
BacktestedEmpirical backtesting reveals that RSI oversold dips (<30) historically yield an average 20-day return of -2.43% with a 42.86% win rate (28 observations, Reliability: Moderate), while volume spikes yield an average 20-day return of +1.21% (44.44% win rate).
Price sits 82.41% below All-Time High (1.99 set 658 sessions ago on 2024-01-31) and 50.7% below its 52-week high (0.71 on 2025-12-07).