


Cairo Poultry
POULCairo Poultry Co.
Company Overview & Activities
انتاج بيض التفريخ من انتاج الأمهات ، انتاج الكتاكيت من بيض التفريخ ، انتاج البدارى ( تربية الكتاكيت ) انشاء غرف تبريد لخدمة أغراض الشركة ، انتاج بيض المائدة من تربية دجاج بيض ، إقامة و تشغيل مصانع الاعلاف لانتاج جميع أنواع الاغلاف ، و مركزاتها الحيوانية و الداجنة و الأسماك و الاعلاف غير التقليدية ، و انشاء مجزر آلى للدواجن ، تصنيع مخلفات المجازر ، القيام بعمليات تصدير منتجات الشركة ، فتح فروع و منح توكيلات لبيع منتجات الشركة في انحاء جمهورية مصر العربية ، الاتجار في كافة منتجات و مستلزمات انتاج الشركة ، المشاركة في المشاريع المشابهه في الداخل و الخارج ، مع مراعاة احكام القوانين و اللوائح و القرارات السارية و بشرط استصدار التراخيص اللازمة لممارسة هذه الأنشطة ، يجوز للشركة ان تكون لها مصلحه او تشترك باى وجه من الوجوه مع الهيئات الأخرى التي تزاول اعمالا شبيهة باعمالها او التي قد تعاونها على تحقيق غرضها في مصر او الخارج كما يجوز لها ان تندمج في الهيئات السالفة او تشتريها او تلحقها بها و ذلك بموافقة الهيئة العامة للاستثمار ، و على الشركة الحصول على كافة التراخيص اللازمة لمباشرة نشاطها
EGS02051C018
1995-11-05
FRA Certified Auditor
Financial FAQ & Technical Outlook for Cairo Poultry Co. (POUL)
Quantitative Technical Engine (POUL)
Cairo Poultry holds a Bearish technical posture (Overall Score: 27.5/100) with Trend Score 0/100, Momentum Score 55/100 (RSI 19.07 - Oversold), and Volume Score 10/100 (distributing, 2.4x 20D baseline).
Support & Resistance Confluence Matrix
AlgorithmicNearest support is at 8.01 [Strength: 45.0/100, Tier 3 (Intraday 1-min)] (0.12% below price with a 100.0% confirmed bounce rate across 1 tests, Reliability: Low). Nearest resistance is at 8.11 [Strength: 45.0/100, Tier 3 (Intraday 1-min)] (1.12% above price with a 100.0% confirmed rejection rate across 1 tests, Reliability: Low).
Seasonal Trend & Historical Patterns (POUL)
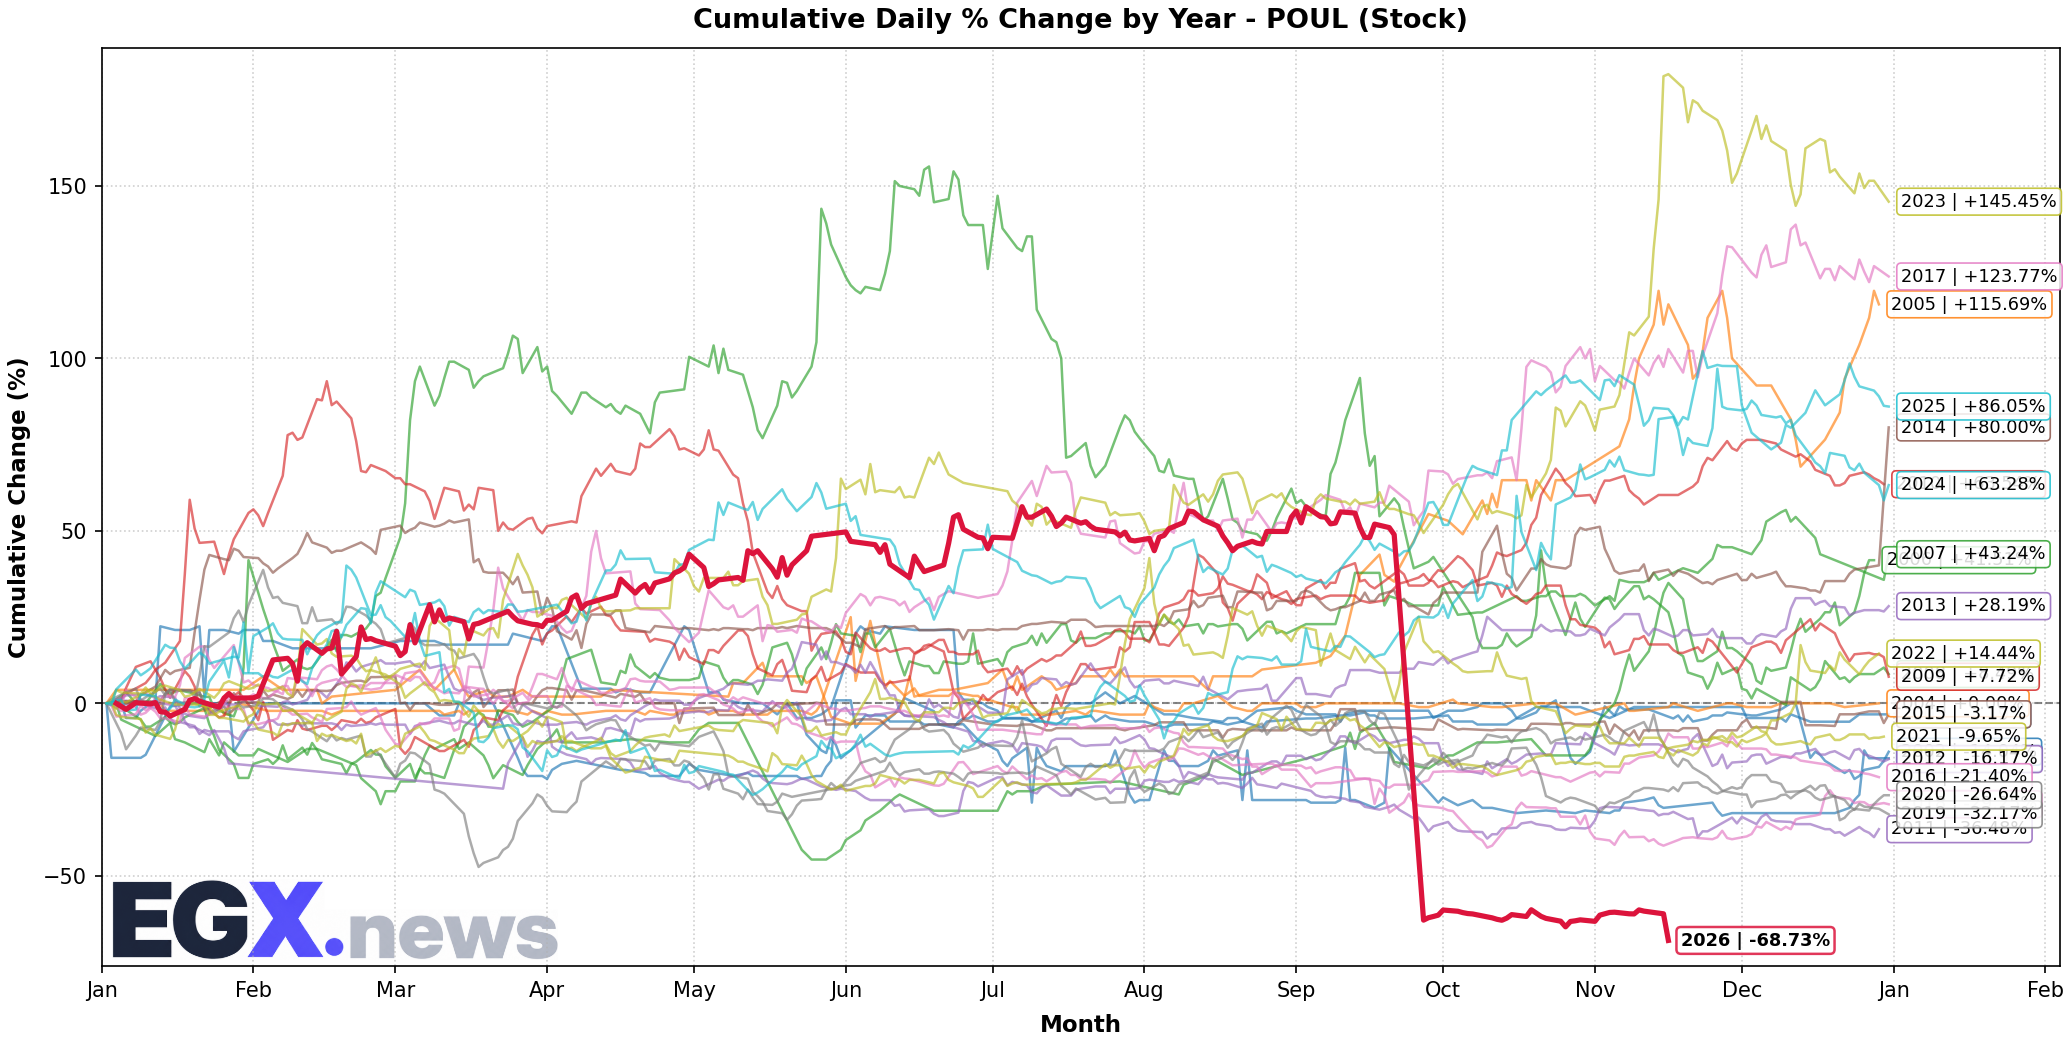
Click to EnlargeHistorical monthly seasonal return distribution and performance cycles for POUL.
Trend Structure & Moving Averages
Trend Score is 0/100 with price trading 17.57% below its 20-day SMA and below the 200-day long-term benchmark (SMA50 is below SMA200).
Momentum, Volume Flow & Volatility
RSI(14) is 19.07 (Oversold), moving -6.03 over the past 5 sessions — signaling severe oversold conditions poised for a potential technical rebound. MACD line (-1.811) is above signal line (-2.398) with a histogram of +0.587 (Bullish Momentum).
20-day annualized volatility is 78.69%, ATR(14) is 0.7 (8.73% of price), and price is trading near the lower band (%B: -0.321, Bandwidth: 21.48%).
Statistical Backtests & Historical Win Rates
BacktestedEmpirical backtesting reveals that RSI oversold dips (<30) historically yield an average 20-day return of -0.50% with a 46.81% win rate (94 observations, Reliability: Good), while volume spikes yield an average 20-day return of +2.35% (54.86% win rate).
Price sits 80.89% below All-Time High (41.96 set 42 sessions ago on 2026-09-13) and 80.89% below its 52-week high (41.96 on 2026-09-13).