


Alexandria Containers & Goods
ALCNAlexandria Containers & Goods
Company Overview & Activities
تداول و تخزين الحاويات والبضائع بانواعها بميناء الاسكندرية والدخيلة بالموقع الذى تخصصه الهيئة العامة لميناء الاسكندرية ونقل و تخزين الحاويات والبضائع الى الملاحق المخصصة داخل و خارج مينائى الاسكندريه و الدخيلة والنقل من والى الميناء لهذه النوعية وادارة وتشغيل المحطات متعددة الاغراض بالموانى المختلفة وخارجها والقيام بنشاط الوكالة الملاحية واعمال التخليص الجمركى وللشركة أن تمارس نشاط الاستثمار العقارى بكافة صوره وأشكاله سواء بنفسها أو بالوكالة منفردة أو بالاشتراك مع الغير ولها فى سبيل ذلك الحصول على التراخيص اللازمة لمزاولة هذا النشاط وكذا التعاقد مع مكاتب الاستشارات الهندسية وشركات المقاولات وكافة الشركات العاملة فى هذا الشأن ويجوز للشركة المساهمة فى شركات تعمل فى مجالات أخرى. ويجوز للشركة ان تكون لها مصلحة أو ان تشترك بأى وجه من الوجوه مع الجهات التى تزاول اعمالا شبيهة باعمالها أو التى قد تعاونها على تحقيق غرضها فى جمهورية مصر العربية أو فى الخارج أو ان تندمج فيها أو ان تشتريها أو ان تلحقها بها . ولها ان تتعاقد مع وكلاء أو مندوبين لها فى الداخل أو فى الخارج لمعاونتها فى تسويق ن
EGS42111C012
1995-08-16
FRA Certified Auditor
Financial FAQ & Technical Outlook for Alexandria Containers & Goods (ALCN)
Quantitative Technical Engine (ALCN)
Alexandria Containers & Goods holds a Very Bullish technical posture (Overall Score: 82.5/100) with Trend Score 80/100, Momentum Score 90/100 (RSI 52.14 - Bullish Momentum), and Volume Score 70/100 (accumulating, 1.02x 20D baseline).
Support & Resistance Confluence Matrix
AlgorithmicNearest support is at 32.76 [Strength: 45.0/100, Tier 3 (Intraday 1-min)] (0.61% below price with a 100.0% confirmed bounce rate across 1 tests, Reliability: Low). Nearest resistance is at 33.19 [Strength: 63.5/100, Tier 3 (Intraday 1-min)] (0.7% above price with a 93.8% confirmed rejection rate across 32 tests, Reliability: High).
Seasonal Trend & Historical Patterns (ALCN)
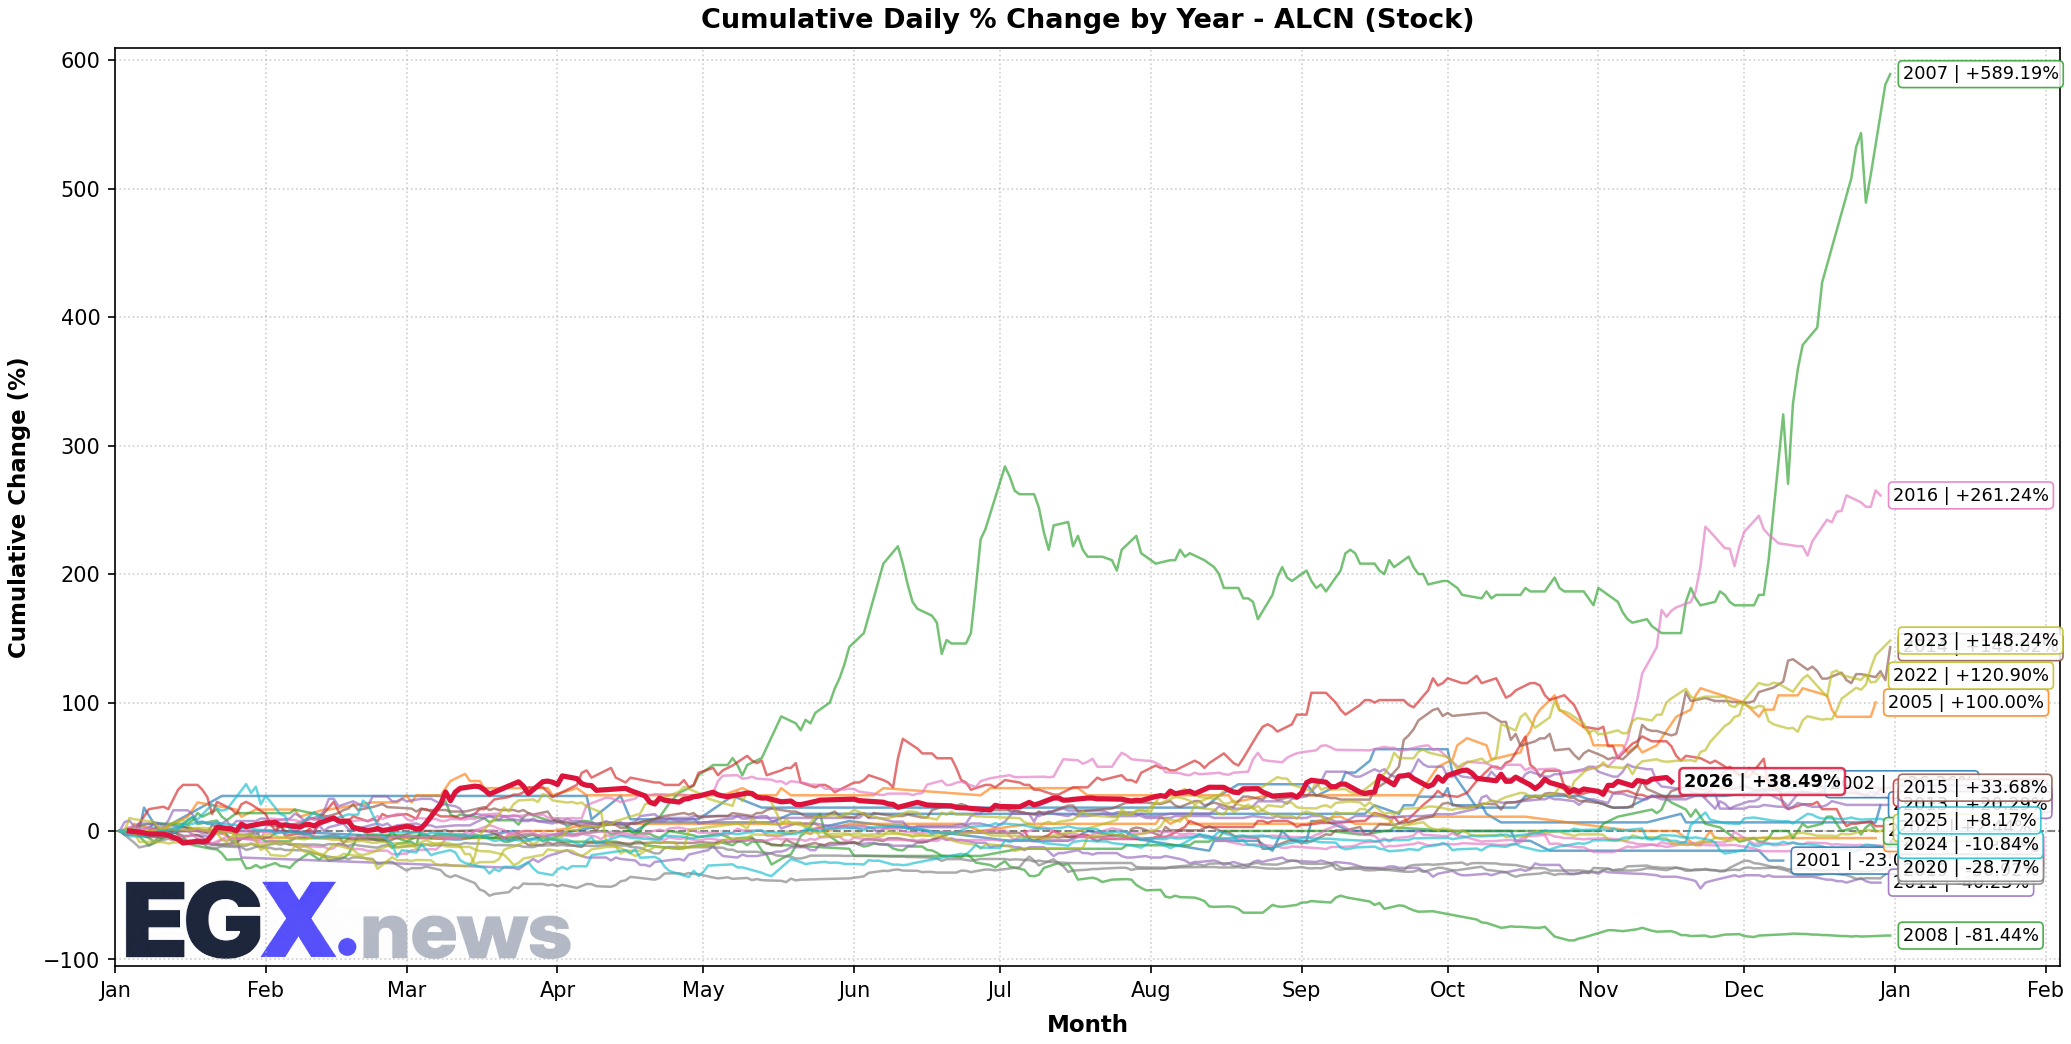
Click to EnlargeHistorical monthly seasonal return distribution and performance cycles for ALCN.
Trend Structure & Moving Averages
Golden Cross (223D)Trend Score is 80/100 with price trading 2.04% above its 20-day SMA and above the 200-day long-term benchmark (SMA50 is above SMA200 for 223 sessions).
Momentum, Volume Flow & Volatility
RSI(14) is 52.14 (Bullish Momentum), moving -1.93 over the past 5 sessions — indicating positive momentum in buyer territory. MACD line (0.168) is above signal line (-0.008) with a histogram of +0.176 (Bullish Momentum).
20-day annualized volatility is 37.46%, ATR(14) is 1.27 (3.85% of price), and price is trading in the middle channel (%B: 0.682, Bandwidth: 11.3%).
Statistical Backtests & Historical Win Rates
BacktestedEmpirical backtesting reveals that RSI oversold dips (<30) historically yield an average 20-day return of +0.02% with a 48.44% win rate (64 observations, Reliability: Good), while volume spikes yield an average 20-day return of +4.91% (53.55% win rate).
Price sits 8.9% below All-Time High (36.18 set 30 sessions ago on 2026-10-04) and 8.9% below its 52-week high (36.18 on 2026-10-04).