


Medical Packaging
MEPAMedical Packaging Company
Company Overview & Activities
طبقا لمحضر الجمعية العامة غير العادية المنعقدة بتاريخ 24\12\2006 ليصبح اقامة وتشغيل مصنع لانتاج العبوات الزجاجية للأغراض الطبية والصيدلية . مع مراعاة أحكام القوانين واللوائح والقرارات السارية وبشرط استصدار التراخيص اللازمة لممارسة هذة الانشطة . ويجوز للشركة أن تكون لها مصلحة أو تشترك بأى وجه من الوجوه مع الشركات وغيرها التى تزاول أعمالا شبيهة بأعمالها أو التى قد تعاونها على تحقيق غرضها فى مصر أو فى الخارج . كما يجوز لها ان تندمج فى الهيئات السالفة أو تشتريها أو تلحقها بها وذلك طبقا لاحكام القانون ولائحتة التنفيذية .
EGS3C4L1C015
2011-08-03
FRA Certified Auditor
Financial FAQ & Technical Outlook for Medical Packaging Company (MEPA)
Quantitative Technical Engine (MEPA)
Medical Packaging holds a Neutral technical posture (Overall Score: 47.8/100) with Trend Score 15/100, Momentum Score 80/100 (RSI 44.15 - Neutral), and Volume Score 70/100 (accumulating, 0.58x 20D baseline).
Support & Resistance Confluence Matrix
AlgorithmicNearest support is at 1.36 [Strength: 45.0/100, Tier 3 (Intraday 1-min)] (1.45% below price with a 100.0% confirmed bounce rate across 1 tests, Reliability: Low). Nearest resistance is at 1.39 [Strength: 45.0/100, Tier 3 (Intraday 1-min)] (0.72% above price with a 100.0% confirmed rejection rate across 1 tests, Reliability: Low).
Seasonal Trend & Historical Patterns (MEPA)
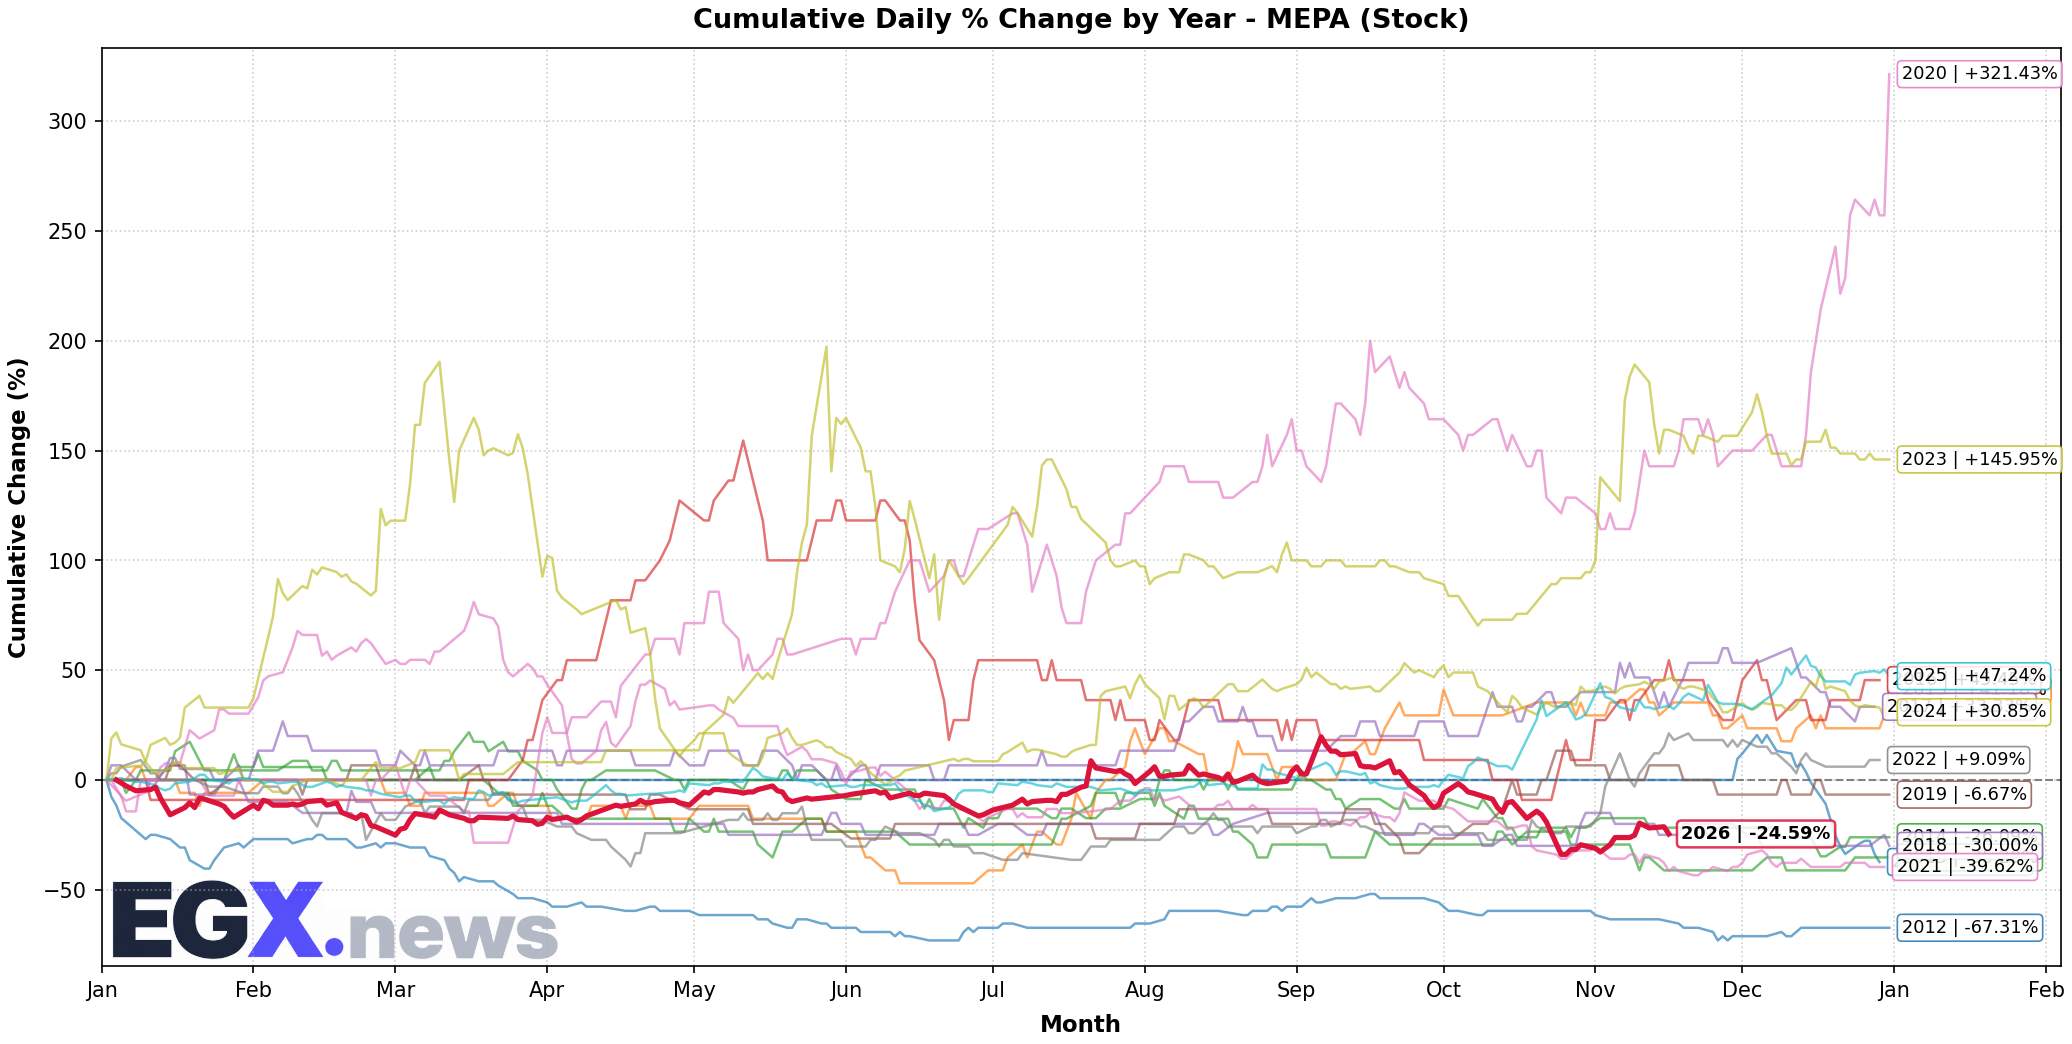
Click to EnlargeHistorical monthly seasonal return distribution and performance cycles for MEPA.
Trend Structure & Moving Averages
Trend Score is 15/100 with price trading 2.22% above its 20-day SMA and below the 200-day long-term benchmark (SMA50 is below SMA200).
Momentum, Volume Flow & Volatility
RSI(14) is 44.15 (Neutral), moving +1.31 over the past 5 sessions — indicating a balanced / consolidation posture. MACD line (-0.05) is above signal line (-0.08) with a histogram of +0.030 (Bullish Momentum).
20-day annualized volatility is 80.99%, ATR(14) is 0.08 (5.8% of price), and price is trading in the middle channel (%B: 0.556, Bandwidth: 33.33%).
Statistical Backtests & Historical Win Rates
BacktestedEmpirical backtesting reveals that RSI oversold dips (<30) historically yield an average 20-day return of +3.64% with a 48.67% win rate (113 observations, Reliability: High), while volume spikes yield an average 20-day return of +4.99% (40.51% win rate).
Price sits 52.08% below All-Time High (2.88 set 632 sessions ago on 2024-03-10) and 38.67% below its 52-week high (2.25 on 2026-09-06).