


Oriental Weavers Carpet
ORWEOriental Weavers Carpet
Company Overview & Activities
?انتاج السجاد الميكانيكي و السجاد النصف يدوي ( الهاند كرافت ) و تسويقه و بيعه في انحاء الجمهورية و تصديره و استراد ما يلزم لانتاج من الات و معدات و خامات . ?التشغيل للغير و لدى الغير ?توريد و تركيب و صيانه جميع أنواع الموكيت و السجاد المنسوج و شراء و استيراد و توريد كافة مستلزمات التركيب و الصيانة ?استيراد كافة أنواع السجاد و المنسوجات الوبرية و غير الوبرية غير تامة الصنع ( من داخل البلاد و خارجها ) و إتمام انتاجها و تجهيزها و إعادة تسويقها و بيعها في انحاء الجمهورية و تصديرها . ?انتاج و بيع و تصدير كافة أنواع الخامات الطبيعية و الصناعية اللازمة لصناعة السجاد سواء في صورة خيوط او في صورة مواد لازمة لانتاج الخيوط و استيراد كافة الاحتياجات اللازمة لتحقيق هذا الغرض . ?استيراد كافة منتجات السجاد ( المكانيكي و اليدوي ) و الاكسسوارات المكملة لتشكيلتها الإنتاجية ( من داخل البلاد و خارجها ) بغرض تسويقها و بيعها في انحاء الجمهورية . ?و يجوز للشركة ان تكون لها مصلحة او تشترك باي و جه من الوجوه مع الجهات التي تباشر نشاطا مماثلا او مكملا او متمما لنشاطها او ان تشتريها و ذلك وفقا
EGS33041C012
1994-12-14
FRA Certified Auditor
Financial FAQ & Technical Outlook for Oriental Weavers Carpet (ORWE)
Quantitative Technical Engine (ORWE)
Oriental Weavers Carpet holds a Neutral technical posture (Overall Score: 57.8/100) with Trend Score 35/100, Momentum Score 90/100 (RSI 52.7 - Bullish Momentum), and Volume Score 70/100 (accumulating, 0.6x 20D baseline).
Support & Resistance Confluence Matrix
AlgorithmicNearest support is at 25.69 [Strength: 45.0/100, Tier 3 (Intraday 1-min)] (0.96% below price with a 100.0% confirmed bounce rate across 1 tests, Reliability: Low). Nearest resistance is at 25.98 (Volume Profile POC Anchor) [Strength: 60.0/100, Tier 3 (Intraday 1-min)] (0.15% above price with a 100.0% confirmed rejection rate across 1 tests, Reliability: Low).
Seasonal Trend & Historical Patterns (ORWE)
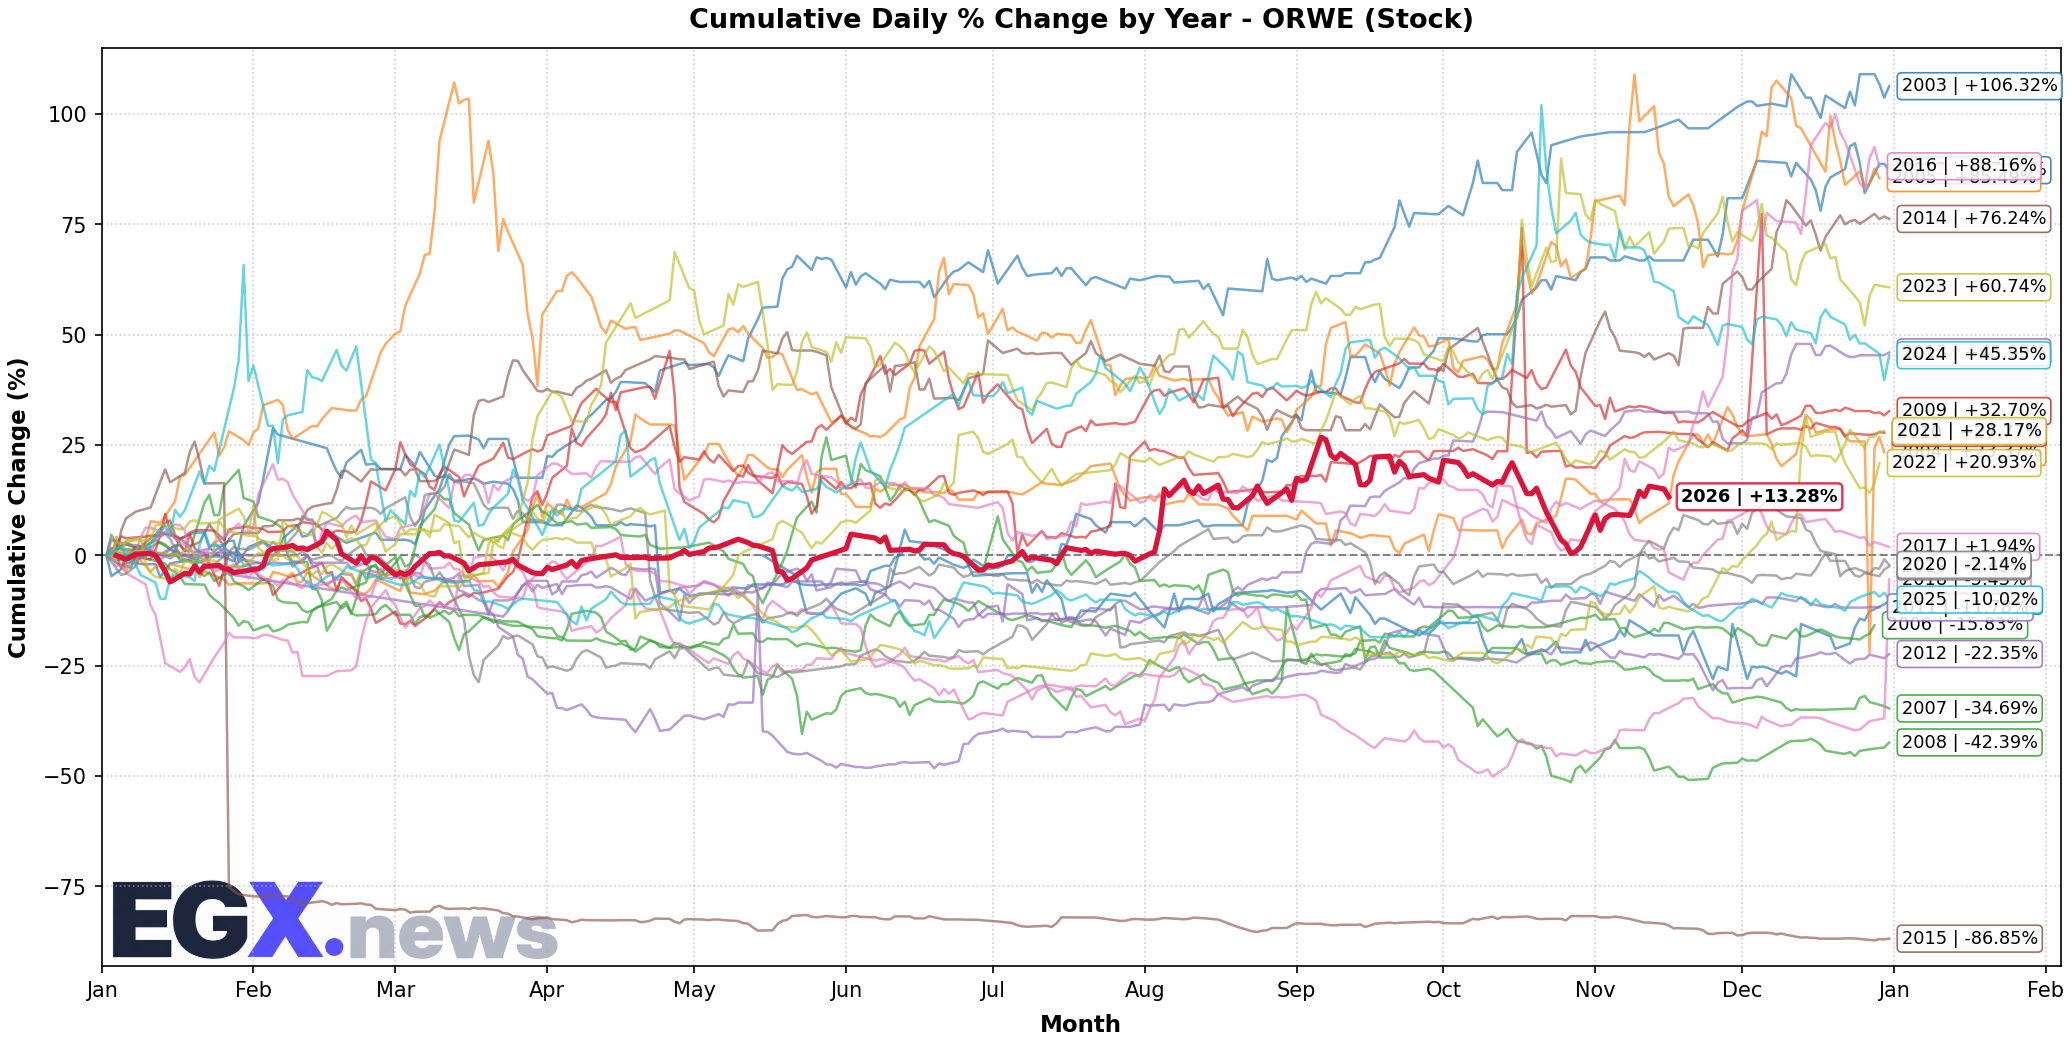
Click to EnlargeHistorical monthly seasonal return distribution and performance cycles for ORWE.
Trend Structure & Moving Averages
Golden Cross (109D)Trend Score is 35/100 with price trading 3.88% above its 20-day SMA and above the 200-day long-term benchmark (SMA50 is above SMA200 for 109 sessions).
Momentum, Volume Flow & Volatility
RSI(14) is 52.7 (Bullish Momentum), moving +1.61 over the past 5 sessions — indicating positive momentum in buyer territory. MACD line (0.016) is above signal line (-0.255) with a histogram of +0.271 (Bullish Momentum).
20-day annualized volatility is 43.1%, ATR(14) is 1.0 (3.86% of price), and price is trading in the middle channel (%B: 0.711, Bandwidth: 18.42%).
Statistical Backtests & Historical Win Rates
BacktestedEmpirical backtesting reveals that RSI oversold dips (<30) historically yield an average 20-day return of -0.34% with a 46.55% win rate (116 observations, Reliability: High), while volume spikes yield an average 20-day return of +1.15% (50.0% win rate).
Price sits 49.46% below All-Time High (51.33 set 2859 sessions ago on 2015-01-20) and 11.8% below its 52-week high (29.41 on 2026-09-06).