


MM Group for Industry & International Trade
MTIEMM Group for Industry & International Trade
Company Overview & Activities
1-إنتاج وتجميع السيارات والجرارات الزراعية ومعداتها واللوادر ووسائل النقل الخفيفة والثقيلة وعمل عمرات المحركات لها وأعمال الصيانة والتركيبات والإصلاح عن طريق مراكز الخدمة المتخصصة واستيراد السيارات والجرارات الزراعية ومعداتها واللوادر ووسائل النقل الخفيفة والثقيلة كاملة وما يلزمها من قطع غيار وصيانة وغيرها . 2-تجهيز وإعداد وتغليف المواسير التي يتم استيرادها بمعرفة الشركة. 3-إنتاج مستلزمات الإنتاج اللازمة لخدمة أغراض الشركة . 4-استيراد كافة السلع والمنتجات المسموح باستيرادها وفقاً للقانون . 5-التوكيلات التجاريه المصريه وتجارة واستيراد الأجهزة الإلكترونية الخاصة بالاستشعار عن بعد مع تقديم الخدمات الفنية والتكنولوجية المتقدمة وكذلك استيراد أجهزة الاتصالات السلكية واللاسلكية وأجهزة التليفونات المحمول وأعمال الصيانة والإصلاح عن طريق مراكز خدمة متخصصة في هذه المجالات 6-شراء وبيع العقارات والأراضي والمنقولات لخدمة أغراض الشركة فيما عدا المناطق التي يصدر بها قرار رئيس الوزراء رقم 12 للقانون رقم 94 لسنة 2005 وكذلك شبة جزيرة سيناء وحلايب وشلاتين تستوجب موافقة رئيس الهيئة العامة ل
EGS75011C014
2016-08-18
FRA Certified Auditor
Financial FAQ & Technical Outlook for MM Group for Industry & International Trade (MTIE)
Quantitative Technical Engine (MTIE)
MM Group for Industry & International Trade holds a Bearish technical posture (Overall Score: 30.5/100) with Trend Score 0/100, Momentum Score 80/100 (RSI 42.43 - Neutral), and Volume Score 10/100 (distributing, 2.34x 20D baseline).
Support & Resistance Confluence Matrix
AlgorithmicNearest support is at 6.8 [Strength: 85.0/100, Tier 1 (Macro 500D)] (1.16% below price with a 100.0% confirmed bounce rate across 11 tests, Reliability: High). Nearest resistance is at 6.9 [Strength: 45.0/100, Tier 3 (Intraday 1-min)] (0.29% above price with a 100.0% confirmed rejection rate across 1 tests, Reliability: Low).
Seasonal Trend & Historical Patterns (MTIE)
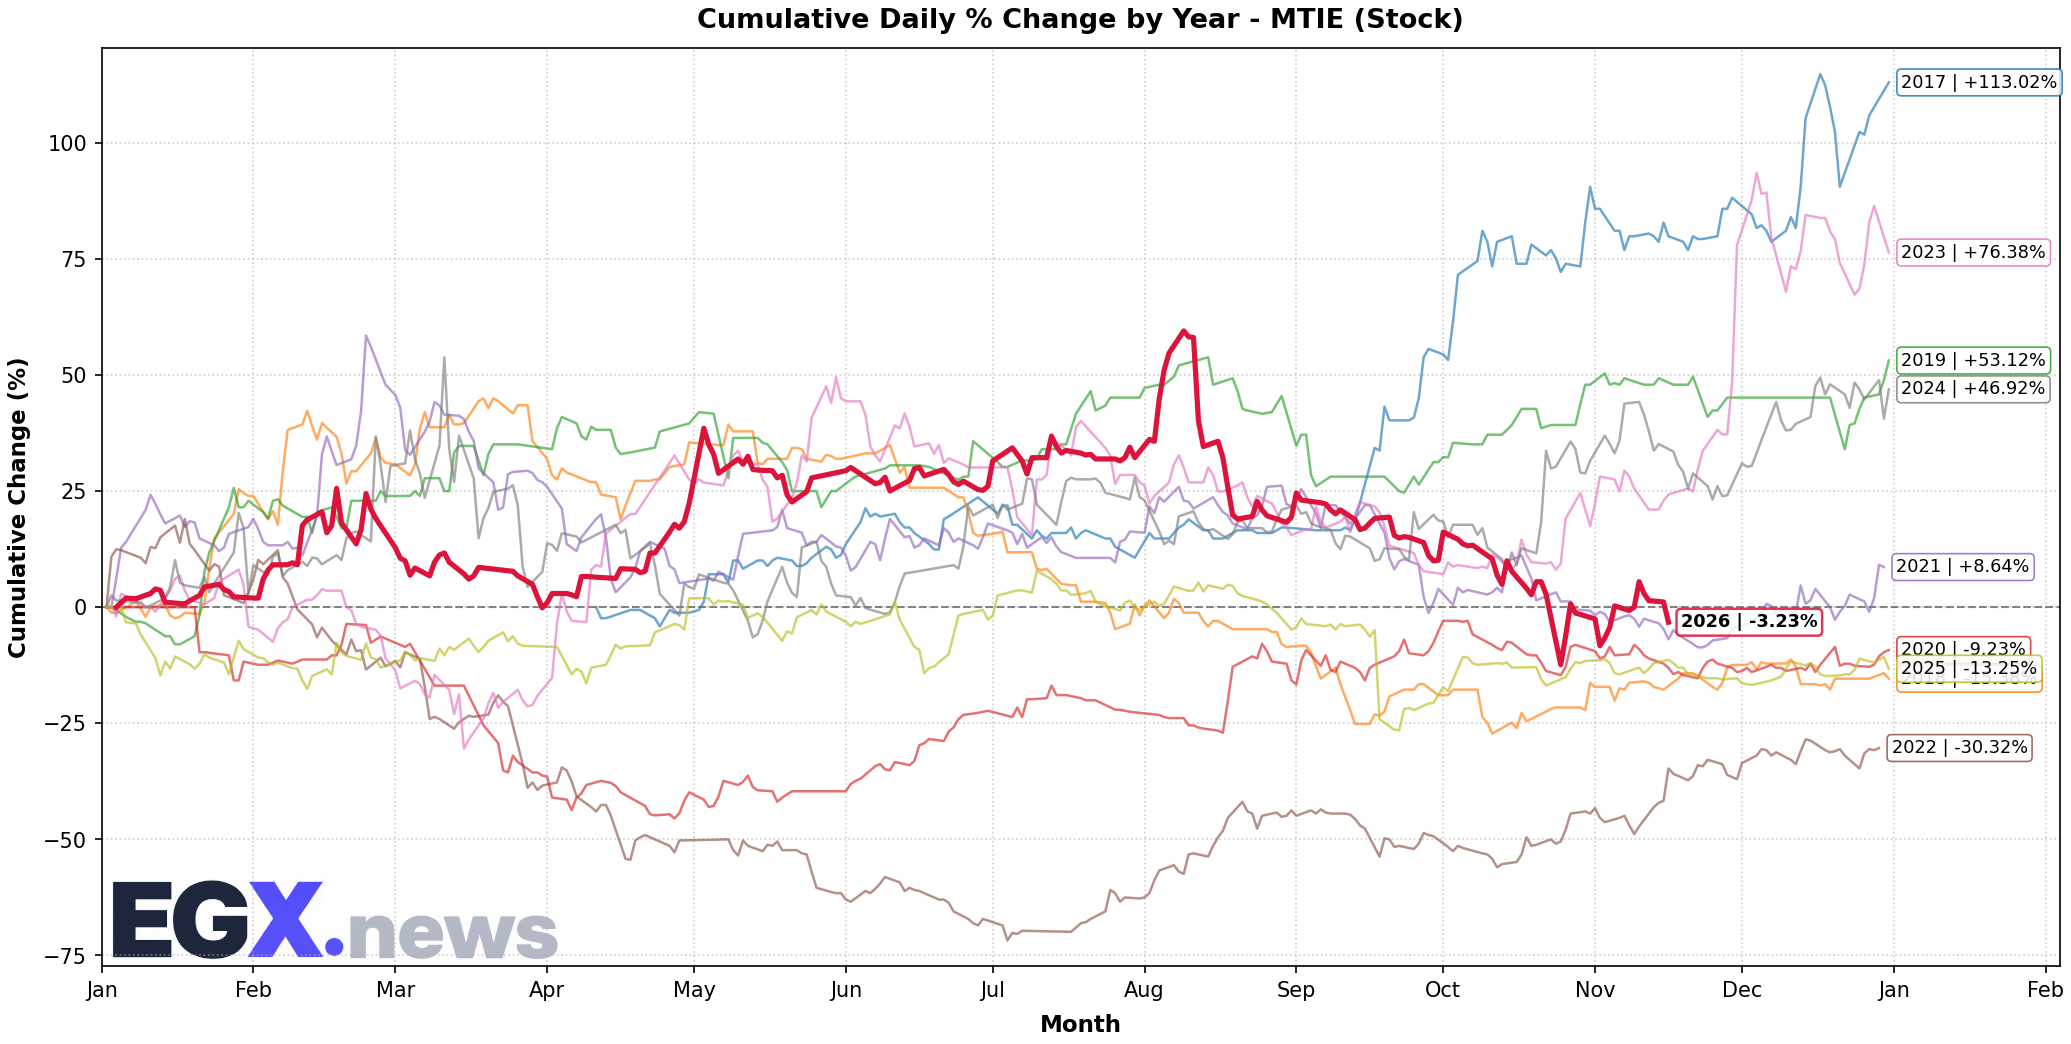
Click to EnlargeHistorical monthly seasonal return distribution and performance cycles for MTIE.
Trend Structure & Moving Averages
Trend Score is 0/100 with price trading 2.13% below its 20-day SMA and below the 200-day long-term benchmark (SMA50 is below SMA200).
Momentum, Volume Flow & Volatility
RSI(14) is 42.43 (Neutral), moving -3.81 over the past 5 sessions — indicating a balanced / consolidation posture. MACD line (-0.153) is above signal line (-0.217) with a histogram of +0.065 (Bullish Momentum).
20-day annualized volatility is 78.64%, ATR(14) is 0.37 (5.38% of price), and price is trading in the middle channel (%B: 0.385, Bandwidth: 19.2%).
Statistical Backtests & Historical Win Rates
BacktestedEmpirical backtesting reveals that RSI oversold dips (<30) historically yield an average 20-day return of +0.81% with a 45.24% win rate (42 observations, Reliability: Moderate), while volume spikes yield an average 20-day return of +3.52% (55.26% win rate).
Price sits 40.28% below All-Time High (11.52 set 68 sessions ago on 2026-08-10) and 40.28% below its 52-week high (11.52 on 2026-08-10).