


Alexandria Flour Mills
AFMCAlexandria Flour Mills Co.
Company Overview & Activities
تصنيع وتجارة واستيراد وتصديروتخزين وتبخير وصيانة وتعبئة وتجهيز وتوزيع الحبوب ومنتجاتها وبدائلها – المخبوزات-المكرونة-العجائن-المربات-الحلاوة الطحينية-البسكويت بأنواعه-المواد الغذائية بصفة عامة-الصفيح وطباعة تصنيع عبوات الصفيح-الاعلاف ومكوناتها-الخمائر-الثلج والتبريد والتجميد-ومستلزمات التعبئة والتغليف-المعدات الرأسمالية وقطع الغيار والانتاج اللازمة أو المتصلة بهذه الاغراض-مخلفات التشغيل والإنتاج وأية أنشطة مكملة أو ملحقة تكفل استغلال الطاقات المتاحة و نشاط الاستثمار العقارى .. وذلك كله لحسابها أو لحساب الغير بمعرفتها أو بمعرفة الغير في جمهورية مصر العربية أو خارجها،وكذلك اعمال الوكالة التجارية عن الغير فى جمهورية مصر العربية او خارجها و يجوز للشركة ان يكون لها مصلحة فى ان تشترك باى وجه من الوجوه مع اى من الاشخاص الاعتبارية او الطبيعية التى تزاول اعمالا مماثلة او شبيهة او التى قد تعاونها على تحقيق اغراضها او تندمج فيها او تشتريها او تستاجرها او تؤجر لها او تلحقها بها و ذلك فى جمهورية مصر العربية او خارجها .
EGS30471C014
1997-04-01
FRA Certified Auditor
Financial FAQ & Technical Outlook for Alexandria Flour Mills Co. (AFMC)
Quantitative Technical Engine (AFMC)
Alexandria Flour Mills holds a Bullish technical posture (Overall Score: 66.2/100) with Trend Score 65/100, Momentum Score 100/100 (RSI 57.64 - Bullish Momentum), and Volume Score 45/100 (accumulating, 3.92x 20D baseline).
Support & Resistance Confluence Matrix
AlgorithmicNearest support is at 146.57 [Strength: 45.0/100, Tier 3 (Intraday 1-min)] (1.39% below price with a 100.0% confirmed bounce rate across 1 tests, Reliability: Low). Nearest resistance is at 150.35 [Strength: 45.0/100, Tier 3 (Intraday 1-min)] (1.15% above price with a 100.0% confirmed rejection rate across 1 tests, Reliability: Low).
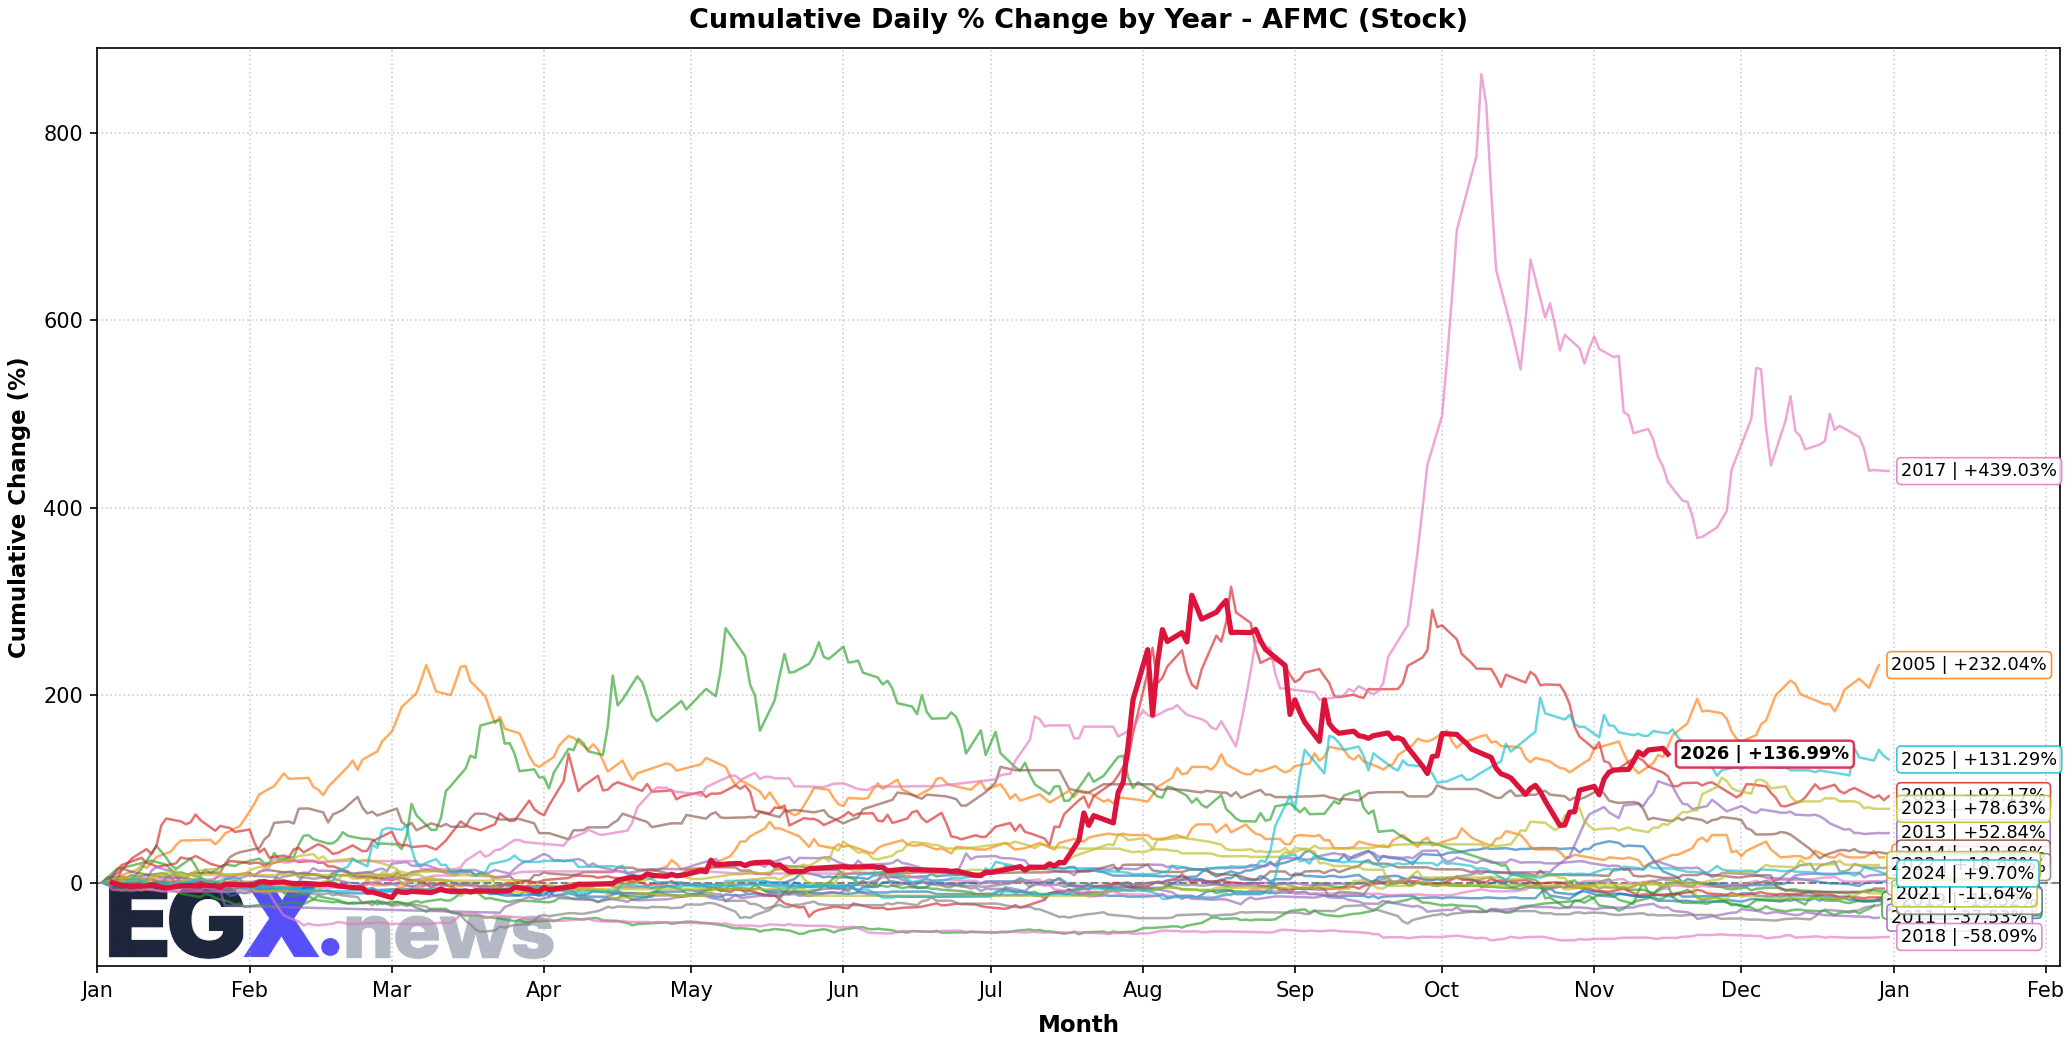
Seasonal Trend & Historical Patterns (AFMC)
Click to EnlargeHistorical monthly seasonal return distribution and performance cycles for AFMC.
Trend Structure & Moving Averages
Golden Cross (500D)Trend Score is 65/100 with price trading 14.21% above its 20-day SMA and above the 200-day long-term benchmark (SMA50 is above SMA200 for 500 sessions).
Momentum, Volume Flow & Volatility
RSI(14) is 57.64 (Bullish Momentum), moving +0.92 over the past 5 sessions — indicating positive momentum in buyer territory. MACD line (2.775) is above signal line (-1.423) with a histogram of +4.198 (Bullish Momentum).
20-day annualized volatility is 90.69%, ATR(14) is 11.81 (7.95% of price), and price is trading in the middle channel (%B: 0.779, Bandwidth: 50.89%).
Statistical Backtests & Historical Win Rates
BacktestedEmpirical backtesting reveals that RSI oversold dips (<30) historically yield an average 20-day return of +1.73% with a 53.27% win rate (107 observations, Reliability: High), while volume spikes yield an average 20-day return of +5.84% (53.07% win rate).
Price sits 50.45% below All-Time High (300.0 set 66 sessions ago on 2026-08-12) and 50.45% below its 52-week high (300.0 on 2026-08-12).