


Alexandria New Medical Center
AMESAlexandria New Medical Center Co.
Company Overview & Activities
انشاء وإدارة وتشغيل المستشفيات المتخصصة و المتكاملة والعامة والمستوصفات والمراكز الطبية والمراكز العلاجية وصيانتها، تدريب وتأهيل الايدى العاملة اللازمة للمستشفيات والمراكز الطبية ، وللشركة الحق في استيراد الالات الطبية والجراحية وكذلك الادوية والمستلزمات الطبية ومستلزمات المعامل وذلك في حدود استخدام الشركة دون الاتجار ، تقديم خدمات الاستشارات الطبية باستخدام كافة الوسائل المقروءة والمسموعة والمرئية والالكترونية وكذا استخدام ما يلزم من إجراءات للدعاية والحجز وكافة الاجراءات بالمستشفيات من خلال مركز اتصالات متخصص ( كول سنتر call center) ،القيام بالتدريب في مجال الإدارة مع مراعاه احكام القوانين واللوائح والقرارات السارية وبشرط استصدار التراخيص اللازمة لممارسة هذه الأنشطة ،ويجوز للشركة ان تكون لها مصلحة او تشترك باى وجه مع الشركات وغيرها التي تزاول اعمالا شبيهة بأعمالها او التي قد تعاونها على تحقيق غرضها في مصر او الخارج . كما يجوز لها ان تندمج في الهيئات السالفة او تشتريها او تلحقهابها وذلك طبقا لاحكام القانون ولائحته التنفيذية
EGS72081C010
1999-09-15
FRA Certified Auditor
Financial FAQ & Technical Outlook for Alexandria New Medical Center Co. (AMES)
Quantitative Technical Engine (AMES)
Alexandria New Medical Center holds a Bullish technical posture (Overall Score: 63.8/100) with Trend Score 45/100, Momentum Score 100/100 (RSI 59.03 - Bullish Momentum), and Volume Score 45/100 (accumulating, 1.57x 20D baseline).
Support & Resistance Confluence Matrix
AlgorithmicNearest support is at 49.96 [Strength: 45.0/100, Tier 3 (Intraday 1-min)] (0.28% below price with a 100.0% confirmed bounce rate across 1 tests, Reliability: Low). Nearest resistance is at 50.69 [Strength: 45.0/100, Tier 3 (Intraday 1-min)] (1.18% above price with a 100.0% confirmed rejection rate across 1 tests, Reliability: Low).
Seasonal Trend & Historical Patterns (AMES)
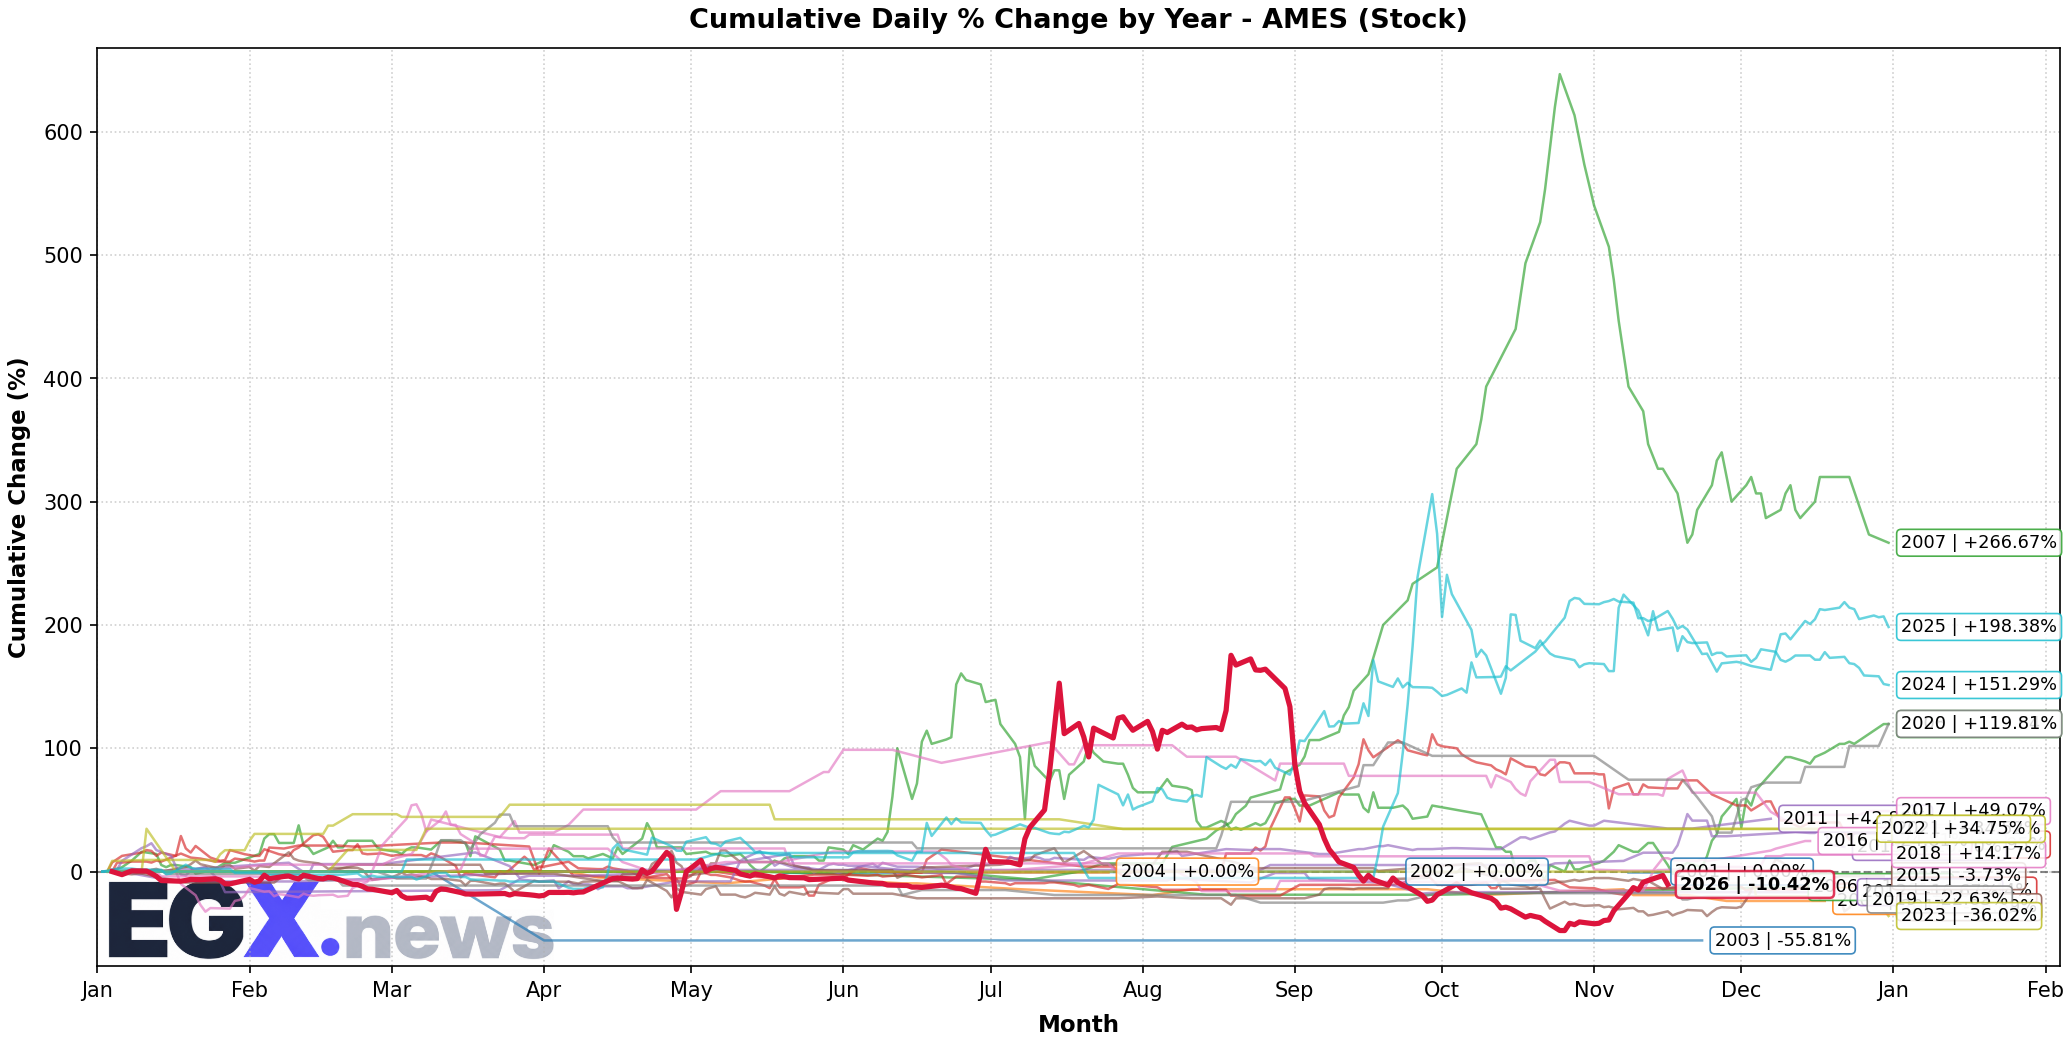
Click to EnlargeHistorical monthly seasonal return distribution and performance cycles for AMES.
Trend Structure & Moving Averages
Trend Score is 45/100 with price trading 28.49% above its 20-day SMA and below the 200-day long-term benchmark (SMA50 is below SMA200).
Momentum, Volume Flow & Volatility
RSI(14) is 59.03 (Bullish Momentum), moving -2.52 over the past 5 sessions — indicating positive momentum in buyer territory. MACD line (1.248) is above signal line (-1.822) with a histogram of +3.070 (Bullish Momentum).
20-day annualized volatility is 115.46%, ATR(14) is 4.28 (8.54% of price), and price is trading near the upper band (%B: 0.824, Bandwidth: 88.05%).
Statistical Backtests & Historical Win Rates
BacktestedEmpirical backtesting reveals that RSI oversold dips (<30) historically yield an average 20-day return of +15.74% with a 41.79% win rate (67 observations, Reliability: Good), while volume spikes yield an average 20-day return of +8.94% (46.91% win rate).
Price sits 71.17% below All-Time High (173.78 set 60 sessions ago on 2026-08-20) and 71.17% below its 52-week high (173.78 on 2026-08-20).