


Amer
AMERAmer Group Holding
Company Overview & Activities
" الاشتراك فى تأسيس الشركات التى تصدر أوراقا مالية أو فى زيادة رؤوس أموالها " وبمراعاة حكم المادة 127 من اللائحة التنفيذية ، يجوز للشركة أن تكون لها مصلحة أو تشترك بأى وجه من الوجوه مع شركات الأموال التى تزاول أعمالا شبيهة بأعمالها ، أو التى قد تعاونها على تحقيق غرضها فى مصر أو فى الخارج . كما يجوز لها ان تندمج فى الشركات أو تشتريها أو تلحقها بها وذلك طبقا لاحكام القانون ولائحتة التنفيذية . وصدرت شهادة ترخيص من الهيئة العامة للرقابة المالية (سوق المال) رقم 462 بتاريخ 20/5/2008 بمزاولة نشاط " الاشتراك فى تأسيس الشركات التى تصدر أوراقا مالية أو فى زيادة رؤوس أموالها " طبقا لأحكام القانون رقم 95 لسنة 1992 ولائحتة التنفيذية وقد قيدت الشركة بالسجل المعد لذلك بالهيئة برقم (462) بتاريخ 13/5/2008 .
EGS675S1C011
2010-11-09
FRA Certified Auditor
Financial FAQ & Technical Outlook for Amer Group Holding (AMER)
Quantitative Technical Engine (AMER)
Amer holds a Neutral technical posture (Overall Score: 54.0/100) with Trend Score 20/100, Momentum Score 80/100 (RSI 44.41 - Neutral), and Volume Score 70/100 (accumulating, 0.91x 20D baseline).
Support & Resistance Confluence Matrix
AlgorithmicNearest support is at 4.21 [Strength: 45.0/100, Tier 3 (Intraday 1-min)] (0.71% below price with a 100.0% confirmed bounce rate across 1 tests, Reliability: Low). Nearest resistance is at 4.29 [Strength: 45.0/100, Tier 3 (Intraday 1-min)] (1.18% above price with a 100.0% confirmed rejection rate across 1 tests, Reliability: Low).
Seasonal Trend & Historical Patterns (AMER)
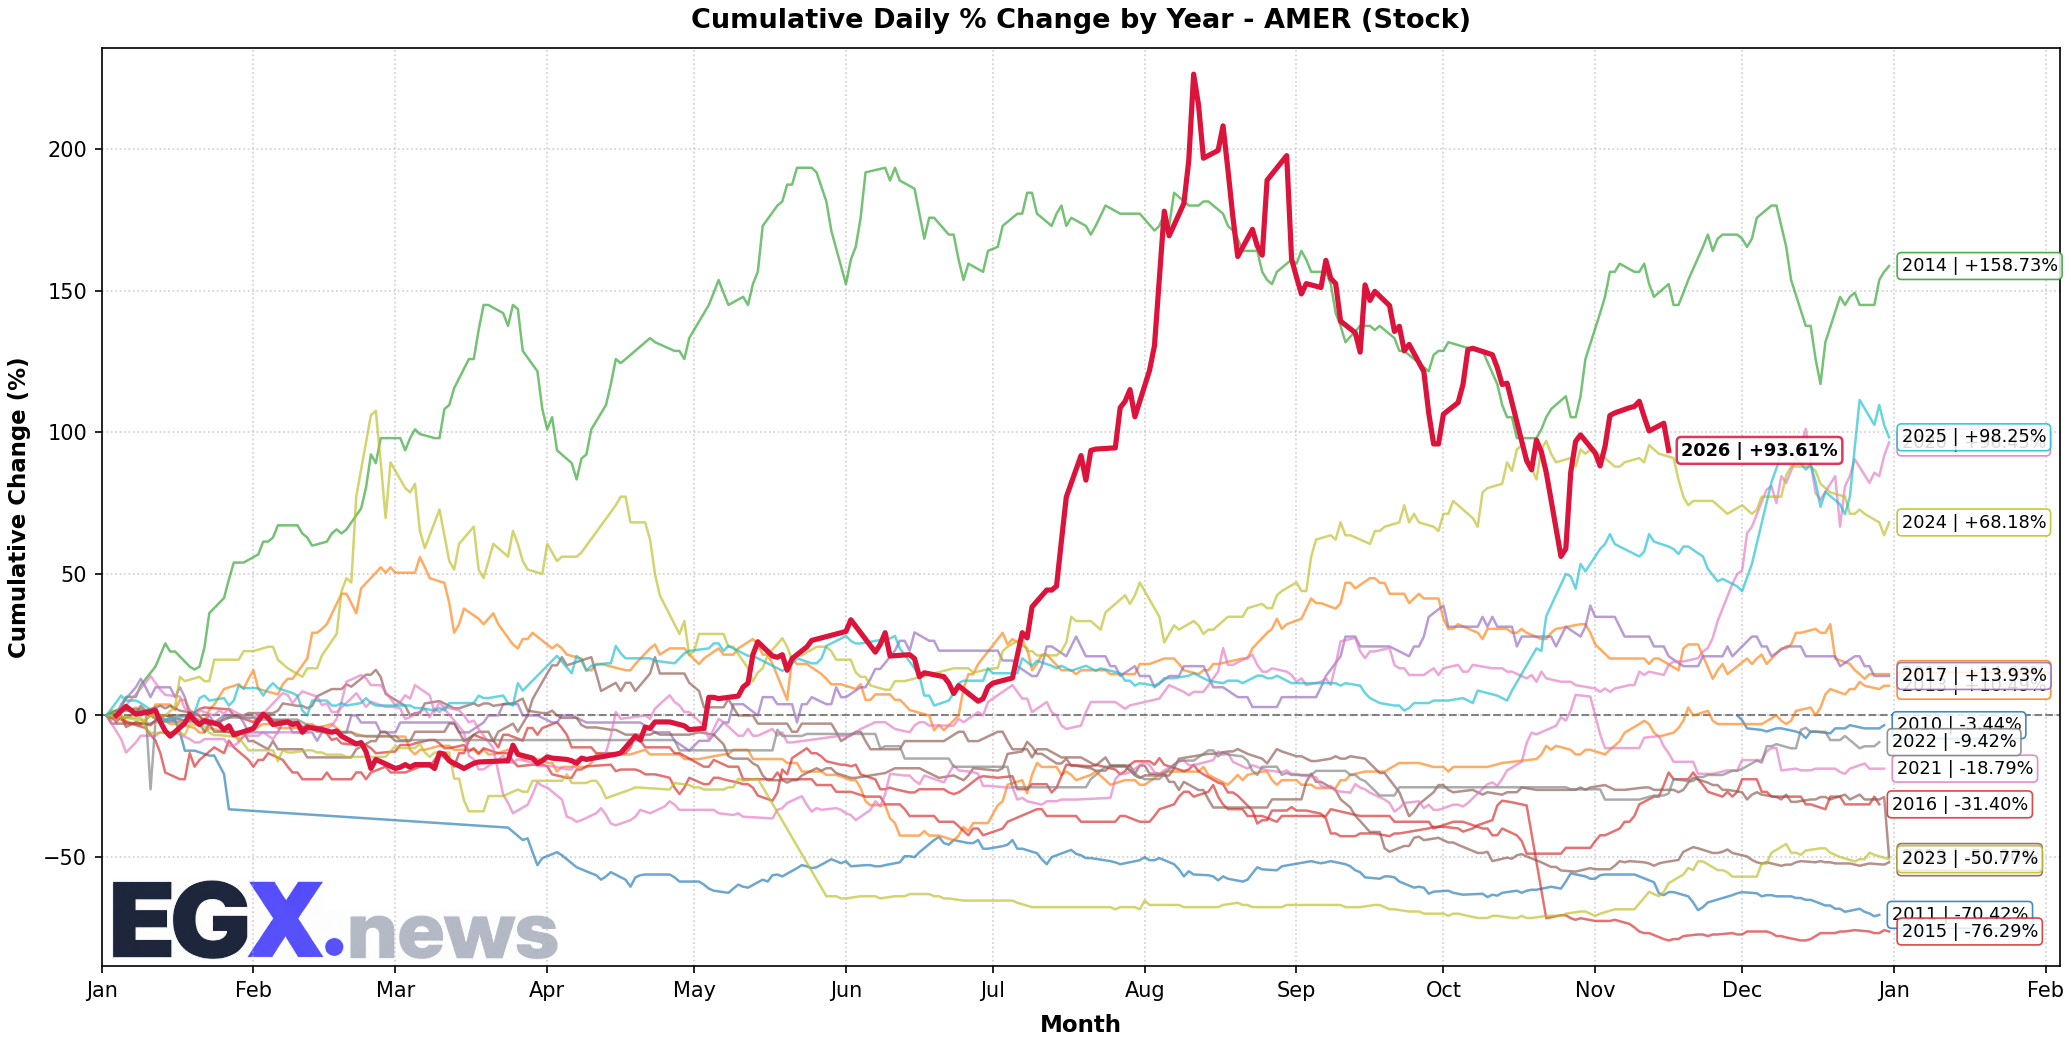
Click to EnlargeHistorical monthly seasonal return distribution and performance cycles for AMER.
Trend Structure & Moving Averages
Golden Cross (247D)Trend Score is 20/100 with price trading 0.47% below its 20-day SMA and above the 200-day long-term benchmark (SMA50 is above SMA200 for 247 sessions).
Momentum, Volume Flow & Volatility
RSI(14) is 44.41 (Neutral), moving -8.48 over the past 5 sessions — indicating a balanced / consolidation posture. MACD line (-0.047) is above signal line (-0.085) with a histogram of +0.038 (Bullish Momentum).
20-day annualized volatility is 98.31%, ATR(14) is 0.3 (7.08% of price), and price is trading in the middle channel (%B: 0.485, Bandwidth: 30.52%).
Statistical Backtests & Historical Win Rates
BacktestedEmpirical backtesting reveals that RSI oversold dips (<30) historically yield an average 20-day return of +0.93% with a 47.69% win rate (130 observations, Reliability: High), while volume spikes yield an average 20-day return of +2.65% (50.48% win rate).
Price sits 71.47% below All-Time High (14.86 set 2998 sessions ago on 2014-06-09) and 49.94% below its 52-week high (8.47 on 2026-08-12).