


Arab Real Estate Investment
RREIArab Real Estate Investment Co.
Company Overview & Activities
القيام بجميع الاعمال المتعلقة والمرتبطة بمشروعات البناء والاسكان والسياحة والتنمية العمرانية والاستثمار والمشروعات الصناعية ولتحقيق هذا الغرض للشركة القيام بما يلى : - - بناء العقارات بمختلف انواعها ومستوياتها وتمليكها وتمليك الوحدات أو تأجيرها والاسكان الادارى والتجارى بما فى ذلك المسارح ودور السينما والمستشفيات والمدارس والمبانى الرياضية والترفيهية والاسواق والجراجات 0000000000 الخ . وتم أضافة نشاط التأجير التمويلى ، التسويق العقارى لمشروعات الشركة وللغير إقامة المعارض فى الداخل والخارج . ويجوز للشركة أن تكون لها مصلحة أو تشترك بأى وجه من الوجوه مع الهيئات التى تزاول أعمالا شبيهة بأعمالها والتى قد تعاونها على تحقيق غرضها فى مصر أو فى الخارج كما يجوز لها ان تندمج فى الهيئات السالفة أو تشتريها أو تلحقها بها وذلك طبقا لاحكام القانون ولائحتة التنفيذية .
EGS65011C016
2011-08-11
FRA Certified Auditor
Financial FAQ & Technical Outlook for Arab Real Estate Investment Co. (RREI)
Quantitative Technical Engine (RREI)
Arab Real Estate Investment holds a Bearish technical posture (Overall Score: 39.0/100) with Trend Score 10/100, Momentum Score 80/100 (RSI 40.43 - Neutral), and Volume Score 35/100 (distributing, 1.02x 20D baseline).
Support & Resistance Confluence Matrix
AlgorithmicNearest support is at 2.75 [Strength: 45.0/100, Tier 3 (Intraday 1-min)] (1.08% below price with a 100.0% confirmed bounce rate across 1 tests, Reliability: Low). Nearest resistance is at 2.8 [Strength: 77.4/100, Tier 1 (Macro 500D)] (0.72% above price with a 69.6% confirmed rejection rate across 23 tests, Reliability: High).
Seasonal Trend & Historical Patterns (RREI)
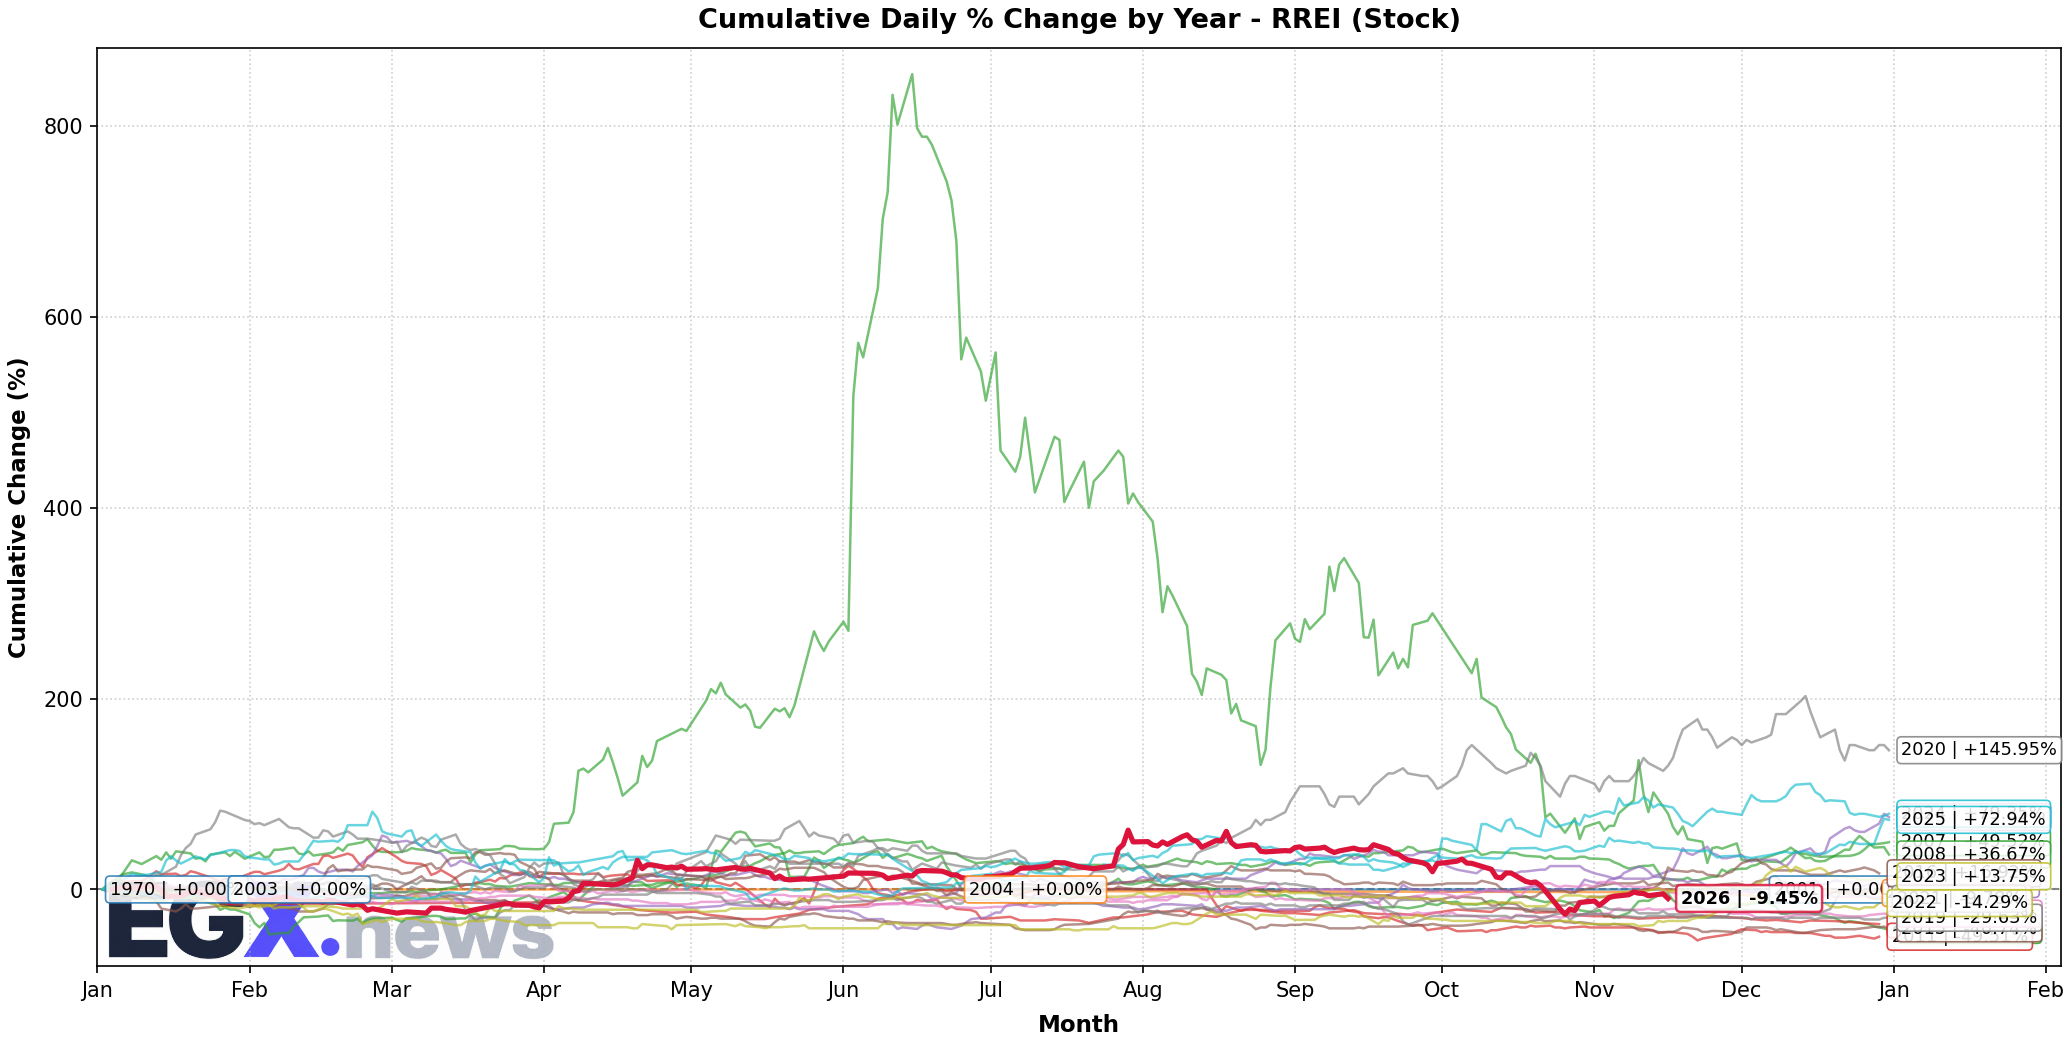
Click to EnlargeHistorical monthly seasonal return distribution and performance cycles for RREI.
Trend Structure & Moving Averages
Golden Cross (525D)Trend Score is 10/100 with price trading 0.0% above its 20-day SMA and below the 200-day long-term benchmark (SMA50 is above SMA200 for 525 sessions).
Momentum, Volume Flow & Volatility
RSI(14) is 40.43 (Neutral), moving -5.66 over the past 5 sessions — indicating a balanced / consolidation posture. MACD line (-0.164) is above signal line (-0.229) with a histogram of +0.064 (Bullish Momentum).
20-day annualized volatility is 100.38%, ATR(14) is 0.21 (7.55% of price), and price is trading in the middle channel (%B: 0.5, Bandwidth: 38.85%).
Statistical Backtests & Historical Win Rates
BacktestedEmpirical backtesting reveals that RSI oversold dips (<30) historically yield an average 20-day return of +5.36% with a 60.36% win rate (111 observations, Reliability: High), while volume spikes yield an average 20-day return of +4.69% (54.85% win rate).
Price sits 88.04% below All-Time High (23.25 set 4290 sessions ago on 2008-06-03) and 45.38% below its 52-week high (5.09 on 2026-08-19).