


Arabia for Investment and Development
AIDCArabia for Investment and Development
Company Overview & Activities
الاستثمار والمساهمة والاشتراك في تأسيس الشركات والمشروعات التي تعمل في مجال الاستيراد والتصدير، مراكز الصيانة المحلية والإقليمية وكافة أنشطة الصناعة والتجارة والنقل والتوريدات والمقاولات العمومية والوكالة التجارية، اعمال التطوير والاستثمار والتسويق العقاري، إقامة وتشغيل محطات انتاج الطاقة ومصانع لإنتاج الطوب والبلاط، تقديم كافة الخدمات والاعمال البترولية ، إقامة المشروعات الميكانيكية والكهربائية، وكل ما سبق فيما عدا ممارسة الأنشطة المنصوص عليها في المادة رقم (27) من قانون سوق راس المال رقم 95 لسنة 1992 والمواد 120 و 122 من لائحته التنفيذية
EGS65R01C015
2025-08-07
FRA Certified Auditor
Financial FAQ & Technical Outlook for Arabia for Investment and Development (AIDC)
Quantitative Technical Engine (AIDC)
Arabia for Investment and Development holds a Neutral technical posture (Overall Score: 51.2/100) with Trend Score 25/100, Momentum Score 80/100 (RSI 44.07 - Neutral), and Volume Score 70/100 (accumulating, 0.94x 20D baseline).
Support & Resistance Confluence Matrix
AlgorithmicNearest support is at 0.51 [Strength: 45.0/100, Tier 3 (Intraday 1-min)] (1.92% below price with a 100.0% confirmed bounce rate across 1 tests, Reliability: Low). Nearest resistance is at 0.53 [Strength: 45.0/100, Tier 3 (Intraday 1-min)] (1.92% above price with a 100.0% confirmed rejection rate across 1 tests, Reliability: Low).
Seasonal Trend & Historical Patterns (AIDC)
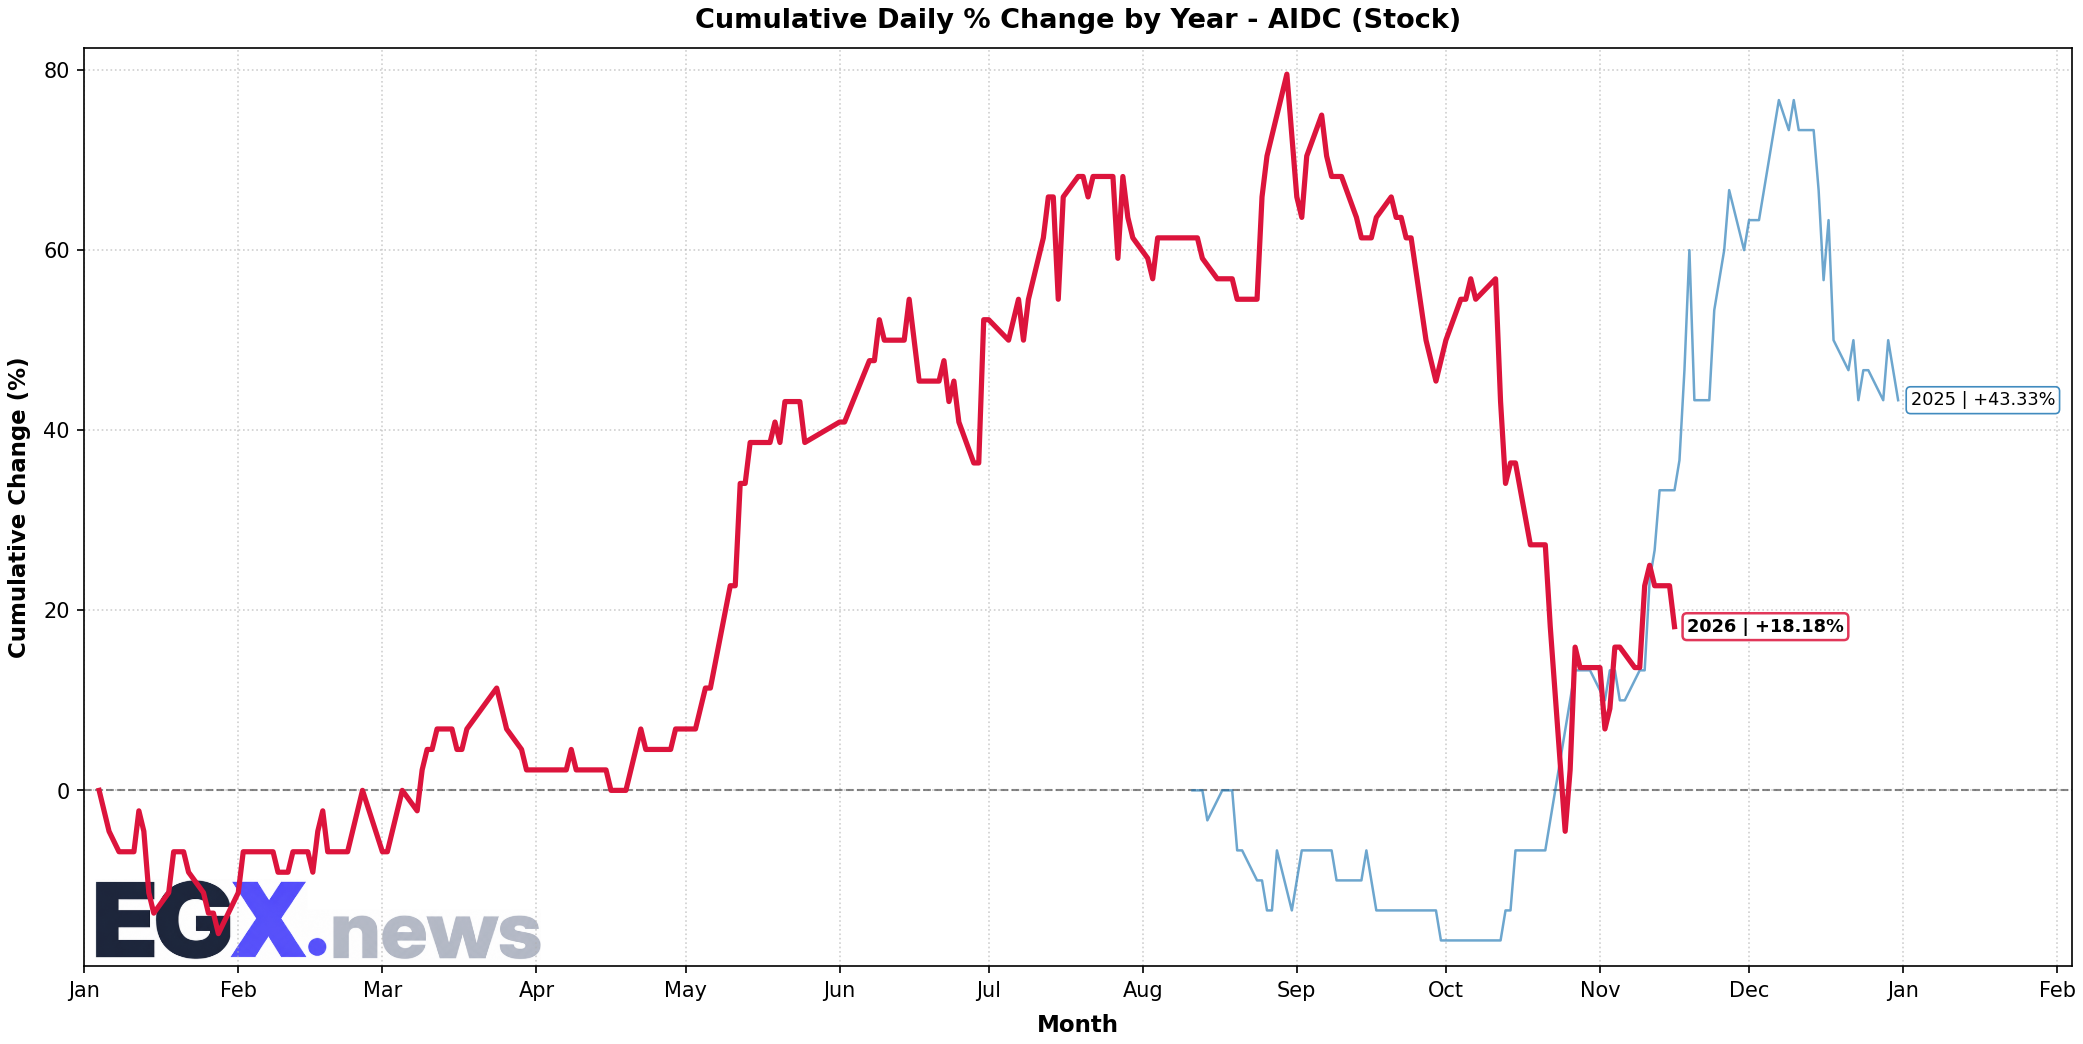
Click to EnlargeHistorical monthly seasonal return distribution and performance cycles for AIDC.
Trend Structure & Moving Averages
Golden Cross (262D)Trend Score is 25/100 with price trading 1.96% above its 20-day SMA and below the 200-day long-term benchmark (SMA50 is below SMA200).
Momentum, Volume Flow & Volatility
RSI(14) is 44.07 (Neutral), moving +5.03 over the past 5 sessions — indicating a balanced / consolidation posture. MACD line (-0.02) is above signal line (-0.031) with a histogram of +0.011 (Bullish Momentum).
20-day annualized volatility is 104.34%, ATR(14) is 0.03 (5.77% of price), and price is trading in the middle channel (%B: 0.571, Bandwidth: 27.45%).
Statistical Backtests & Historical Win Rates
BacktestedEmpirical backtesting reveals that RSI oversold dips (<30) historically yield an average 20-day return of +4.60% with a 33.33% win rate (6 observations, Reliability: Very Low), while volume spikes yield an average 20-day return of +13.70% (66.67% win rate).
Price sits 40.23% below All-Time High (0.87 set 55 sessions ago on 2026-08-30) and 40.23% below its 52-week high (0.87 on 2026-08-30).