


Arabian Food Industries
DOMTArabian Food Industries Co.
Company Overview & Activities
هو تصنيع منتجات الالبان بكافة أنواعها ( آيس كريم – الزبادى – جبن ابيض ومطبوخ والالبان المعقمة ) وكذلك التوسع فى تصنيع المنتجات الاخرى – استصلاح واستزراع الاراضى واقامة مصانع الاعلاف ومزارع انتاج الالبان وتربية الابقار وكافة الصناعات الغذائية وصناعة الأغذية الخاصة والمكملات الغذائية والمخبوزات بكافة أنواعها واستيراد المواد الغذائية المصنعة ونصف مصنعة من الخارج وتعبئتها وتوزيعها وبيع وتسويق المنتجات والمصنوعات الغذائية لحساب الغير من الشركات المحلية و الاجنبية والتوكيلات التجارية فى مجال الصناعات الغذائية . ولها ان تشارك فى الشركات ذات النشاط المماثل والاستعانة بالخبرات الاجنبية فى مجالات النشاط السابق وعلى وجه الخصوص الحصول على حق المعرفة من الشركات الاجنبية ذات النشاط المماثل وللشركة الحق فى استيراد جميع مستلزمات الانتاج اللازمة لنشاطها وتصدير كافة منتجاتها للاسواق العالمية ويجوز للشركة ان تكون لها مصلحة او تشارك باى وجه من الوجوه مع الهيئات التى تزاول اعمالا شبيهة باعمالها او التى قد تعاونها على تحقيق غرضها فى مصر او فى الخارج .
EGS30031C016
2015-12-28
FRA Certified Auditor
Financial FAQ & Technical Outlook for Arabian Food Industries Co. (DOMT)
Quantitative Technical Engine (DOMT)
Arabian Food Industries holds a Bullish technical posture (Overall Score: 63.8/100) with Trend Score 45/100, Momentum Score 100/100 (RSI 56.6 - Bullish Momentum), and Volume Score 45/100 (accumulating, 2.15x 20D baseline).
Support & Resistance Confluence Matrix
AlgorithmicNearest support is at 25.0 [Strength: 63.8/100, Tier 3 (Intraday 1-min)] (0.08% below price with a 95.2% confirmed bounce rate across 63 tests, Reliability: High). Nearest resistance is at 25.33 [Strength: 45.0/100, Tier 3 (Intraday 1-min)] (1.24% above price with a 100.0% confirmed rejection rate across 1 tests, Reliability: Low).
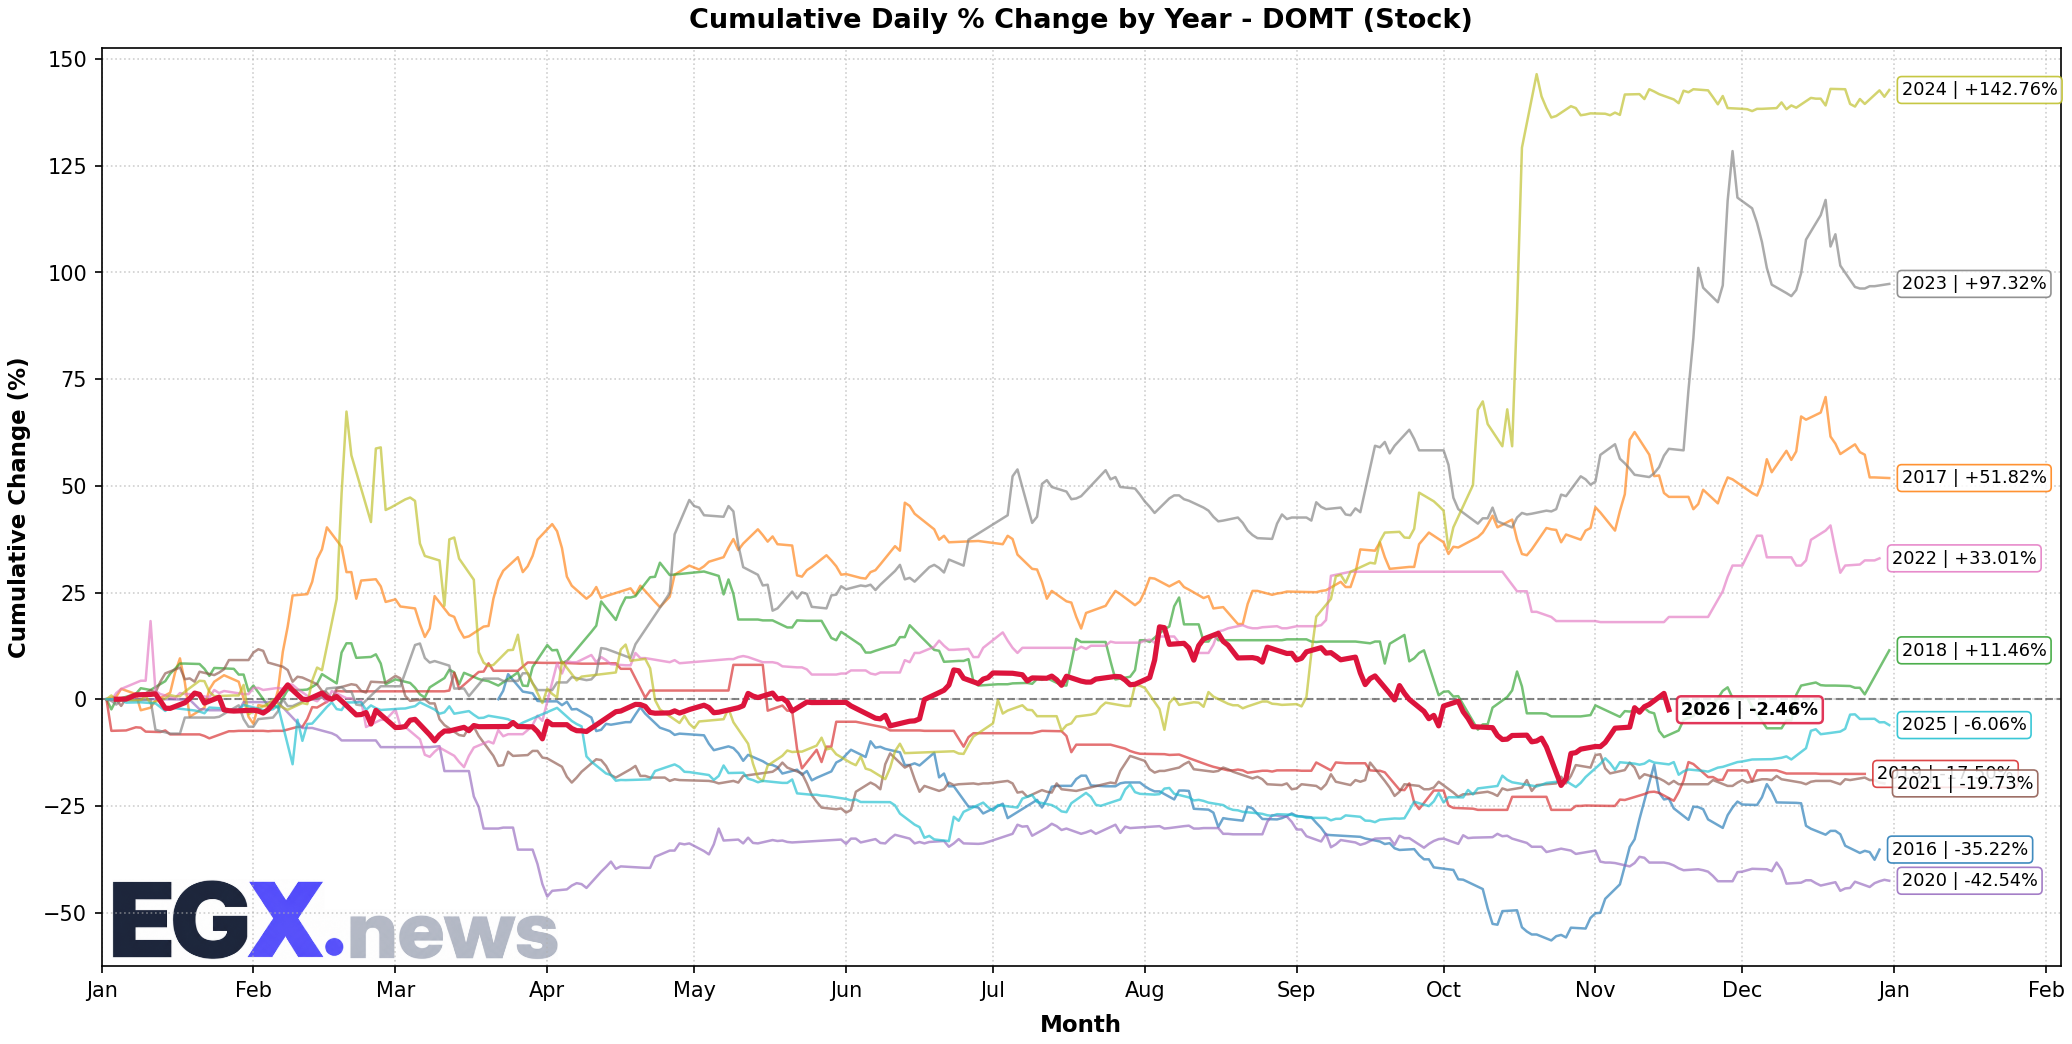
Seasonal Trend & Historical Patterns (DOMT)
Click to EnlargeHistorical monthly seasonal return distribution and performance cycles for DOMT.
Trend Structure & Moving Averages
Trend Score is 45/100 with price trading 6.56% above its 20-day SMA and below the 200-day long-term benchmark (SMA50 is below SMA200).
Momentum, Volume Flow & Volatility
RSI(14) is 56.6 (Bullish Momentum), moving -5.32 over the past 5 sessions — indicating positive momentum in buyer territory. MACD line (0.315) is above signal line (-0.079) with a histogram of +0.394 (Bullish Momentum).
20-day annualized volatility is 53.87%, ATR(14) is 1.12 (4.48% of price), and price is trading in the middle channel (%B: 0.763, Bandwidth: 24.96%).
Statistical Backtests & Historical Win Rates
BacktestedEmpirical backtesting reveals that RSI oversold dips (<30) historically yield an average 20-day return of +0.98% with a 51.02% win rate (49 observations, Reliability: Moderate), while volume spikes yield an average 20-day return of +1.19% (49.72% win rate).
Price sits 21.81% below All-Time High (32.0 set 72 sessions ago on 2026-08-04) and 21.81% below its 52-week high (32.0 on 2026-08-04).