


Atlas for Investment & Food Industries
AIFIAtlas for Investment & Food Industries SAE
Company Overview & Activities
1.إستصلاح الاراضى البور والصحراوية و تجهيز الاراضى بالمرافق الاساسية التى تجعلها قابلة للاستزراع و استزراع الاراضى المستصلحة باستخدام طرق الرى الحديثة . 2.الانتاج الحيوانى و الداجنى و السمكى و يشمل تربية جميع انواع الماشية المنتجة للحوم الحمراء و ذلك لانتاج السلالات او الالبان او التسمين و تربية جميع انواع الدواجن المنتجة للحوم البيضاء سواء كان ذلك لانتاج السلالات او التفريخ او انتاج البيض او التسمين و ايضا اقامة المزارع السمكية و صيد الاسماك . 3- انتاج الزيوت و تعبئتها . 4- الاستثمار العقارى و السياحى حيث يجوز شراء اراضى بغرض استغلالها او تقسيمها او بيعها او تاجيرها او بناء وحدات سكنية او تجارية او خدمية لصالحها او لصالح الغير و القيام باعمال المقاولات العامة و الدخول فى مشاركات سواء بشراء مشروعات قائمة او تحت الانشاء او المساهمة فى شركات قائمة او تقوم الشركة بالمشاركة فى تاسيسها. 5- النقل المبرد او المجمد للبضائع و الثلاجات و المحطات الخاصة بحفظ الحاصلات الزراعية و المنتجات الصناعية و المواد الغذائية و تبريدها او تجميدها لصالح الشركة او الغير . 6- شراء و بيع الاراضى البور و
EGS071L1C018
2012-11-07
FRA Certified Auditor
Financial FAQ & Technical Outlook for Atlas for Investment & Food Industries SAE (AIFI)
Quantitative Technical Engine (AIFI)
Atlas for Investment & Food Industries holds a Bullish technical posture (Overall Score: 77.2/100) with Trend Score 65/100, Momentum Score 85/100 (RSI 68.72 - Strong Bullish Momentum), and Volume Score 100/100 (accumulating, 4.28x 20D baseline).
Support & Resistance Confluence Matrix
AlgorithmicNearest support is at 2.46 (Volume Profile POC Anchor) [Strength: 60.0/100, Tier 3 (Intraday 1-min)] (1.2% below price with a 100.0% confirmed bounce rate across 1 tests, Reliability: Low). Nearest resistance is at 2.5 [Strength: 85.0/100, Tier 1 (Macro 500D)] (0.4% above price with a 100.0% confirmed rejection rate across 14 tests, Reliability: High).
Seasonal Trend & Historical Patterns (AIFI)
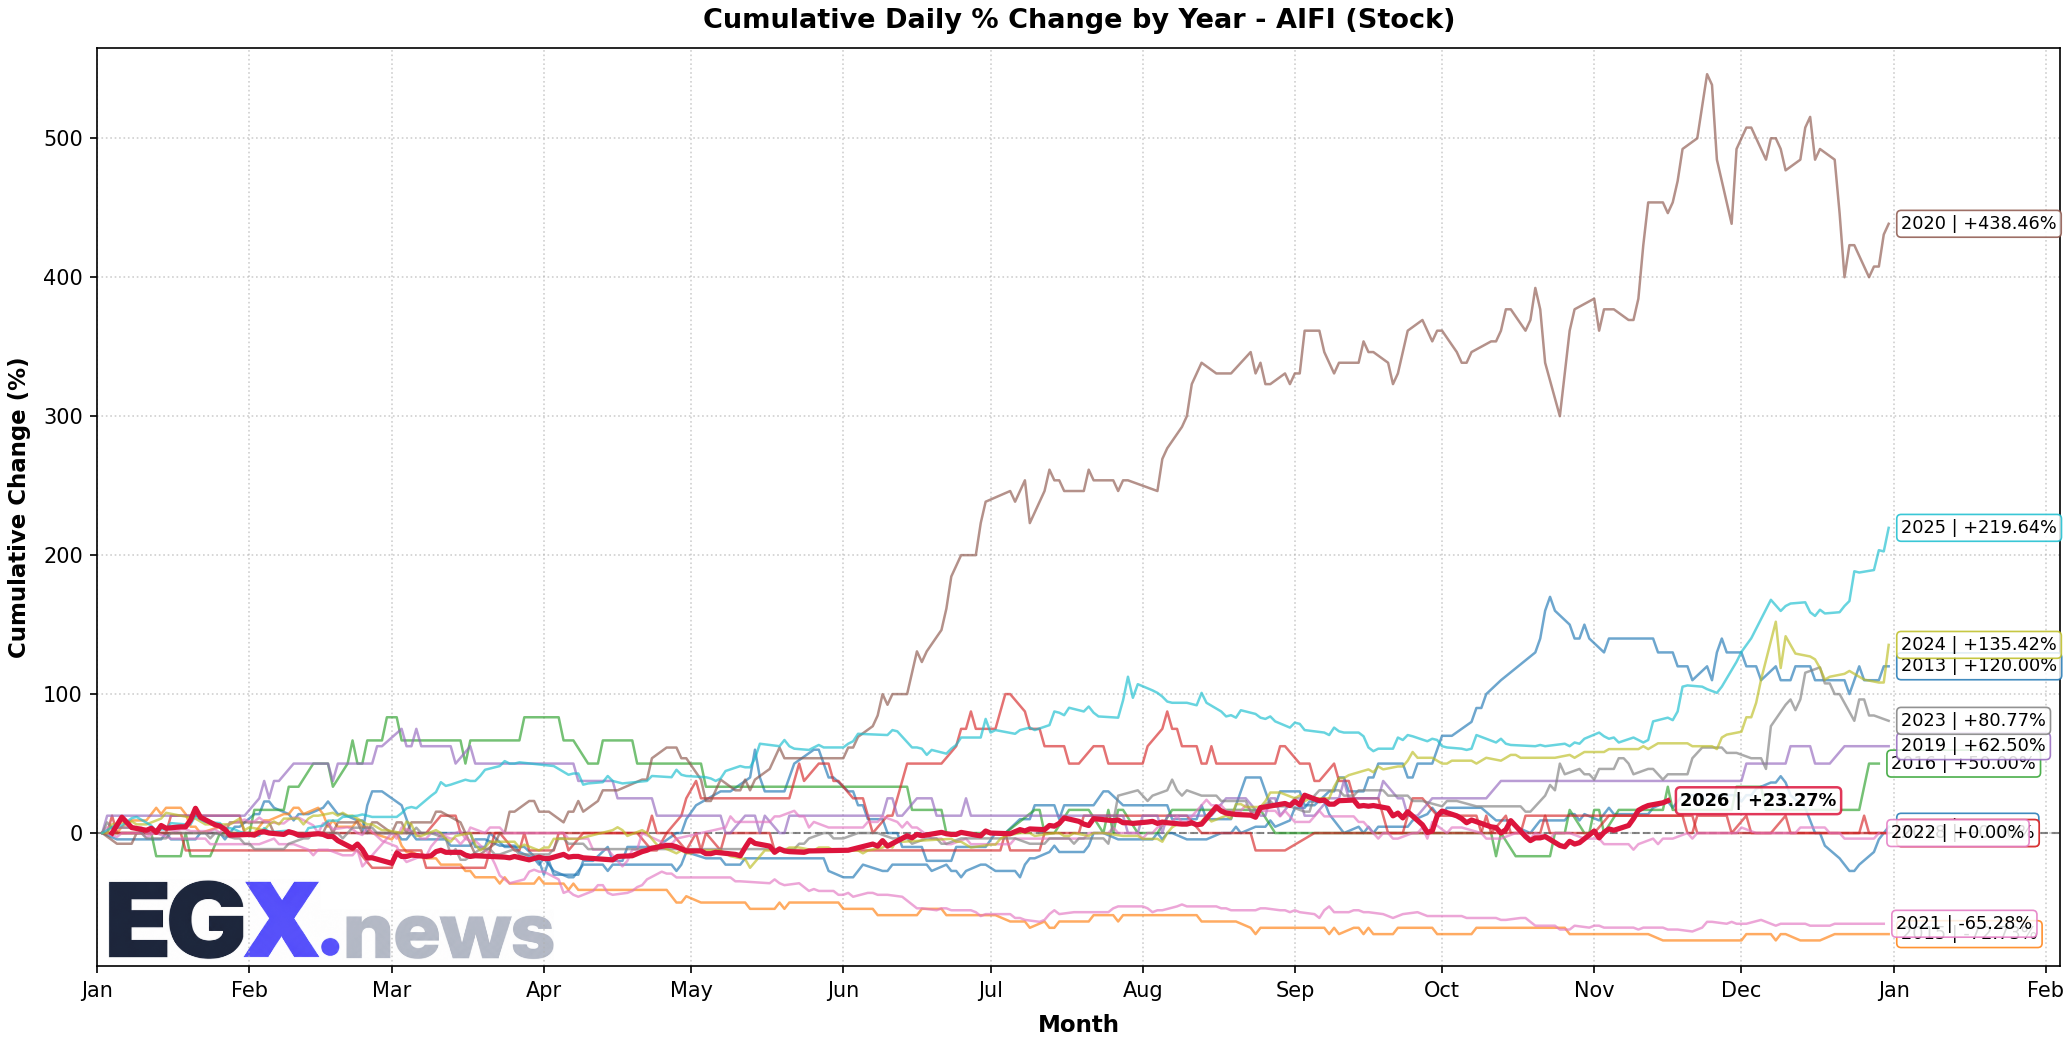
Click to EnlargeHistorical monthly seasonal return distribution and performance cycles for AIFI.
Trend Structure & Moving Averages
Golden Cross (66D)Trend Score is 65/100 with price trading 19.14% above its 20-day SMA and above the 200-day long-term benchmark (SMA50 is above SMA200 for 66 sessions).
Momentum, Volume Flow & Volatility
RSI(14) is 68.72 (Strong Bullish Momentum), moving +9.82 over the past 5 sessions — confirming powerful bullish upward pressure. MACD line (0.087) is above signal line (0.022) with a histogram of +0.066 (Bullish Momentum).
20-day annualized volatility is 56.05%, ATR(14) is 0.13 (5.22% of price), and price is trading near the upper band (%B: 0.955, Bandwidth: 42.11%).
Statistical Backtests & Historical Win Rates
BacktestedEmpirical backtesting reveals that RSI oversold dips (<30) historically yield an average 20-day return of +2.90% with a 45.0% win rate (60 observations, Reliability: Good), while volume spikes yield an average 20-day return of +5.13% (45.86% win rate).
Price sits 31.59% below All-Time High (3.64 set 204 sessions ago on 2025-12-31) and 31.59% below its 52-week high (3.64 on 2025-12-31).