


Bonyan for Development and Trade
BONYBonyan for Development and Trade
Company Overview & Activities
الاستثمار العقاري بكافة أنواعه بما يشمله من بيع وشراء وتأجير العقارات التجارية وغير التجارية والإدارية والسكنية بمختلف أشكالها نقدًا أو بالتقسيط أو بالآجل وممارسة كافة الأنشطة المكملة والمتممة والمرتبطة بأنشطة وأغراض العقارات المملوكة للشركة فيما عدا المناطق الصادر بتحديدها القرار رقم 350 لسنة 2007، بما في ذلك: -إدارة وتشغيل العقارات المملوكة للشركة بكافة أنواعها سواء مباشرة بواسطة الشركة أو الغير وبيع ومنح حقوق الانتفاع والتأجير للمساحات وللوحدات الكائنة بالعقارات سواء نقدًا أو بالتقسيط أو بالآجل وذلك بالشروط والكيفية التي تراها إدارة الشركة مناسبة. -إقامة وتشغيل وإدارة الملاهي والألعاب ومدن الألعاب الترفيهية، وإقامة العروض الفنية والمسرحية والغنائية وإقامة وتنظيم المعارض والمؤتمرات. بشرط استصدار التراخيص اللازمة لكل معرض على حدى، وعرض المصنفات الفنية (سمعية وسمعية بصرية) بكافة الأشكال وممارسة التجارة العامة والتوزيع لجميع المنتجات المسموح بها قانونًا، وذلك كله داخل العقارات المملوكة للشركة. وذلك مع مراعاة أحكام القوانين واللوائح السارية وبشرط استصدار التراخيص اللازمة لممارسة ه
EGS656M1C010
2025-01-22
FRA Certified Auditor
Financial FAQ & Technical Outlook for Bonyan for Development and Trade (BONY)
Quantitative Technical Engine (BONY)
Bonyan for Development and Trade holds a Neutral technical posture (Overall Score: 57.8/100) with Trend Score 55/100, Momentum Score 90/100 (RSI 54.81 - Bullish Momentum), and Volume Score 35/100 (distributing, 0.98x 20D baseline).
Support & Resistance Confluence Matrix
AlgorithmicNearest support is at 4.32 [Strength: 79.4/100, Tier 1 (Macro 500D)] (1.59% below price with a 77.5% confirmed bounce rate across 40 tests, Reliability: High). Nearest resistance is at 4.41 [Strength: 62.1/100, Tier 3 (Intraday 1-min)] (0.46% above price with a 88.6% confirmed rejection rate across 35 tests, Reliability: High).
Seasonal Trend & Historical Patterns (BONY)
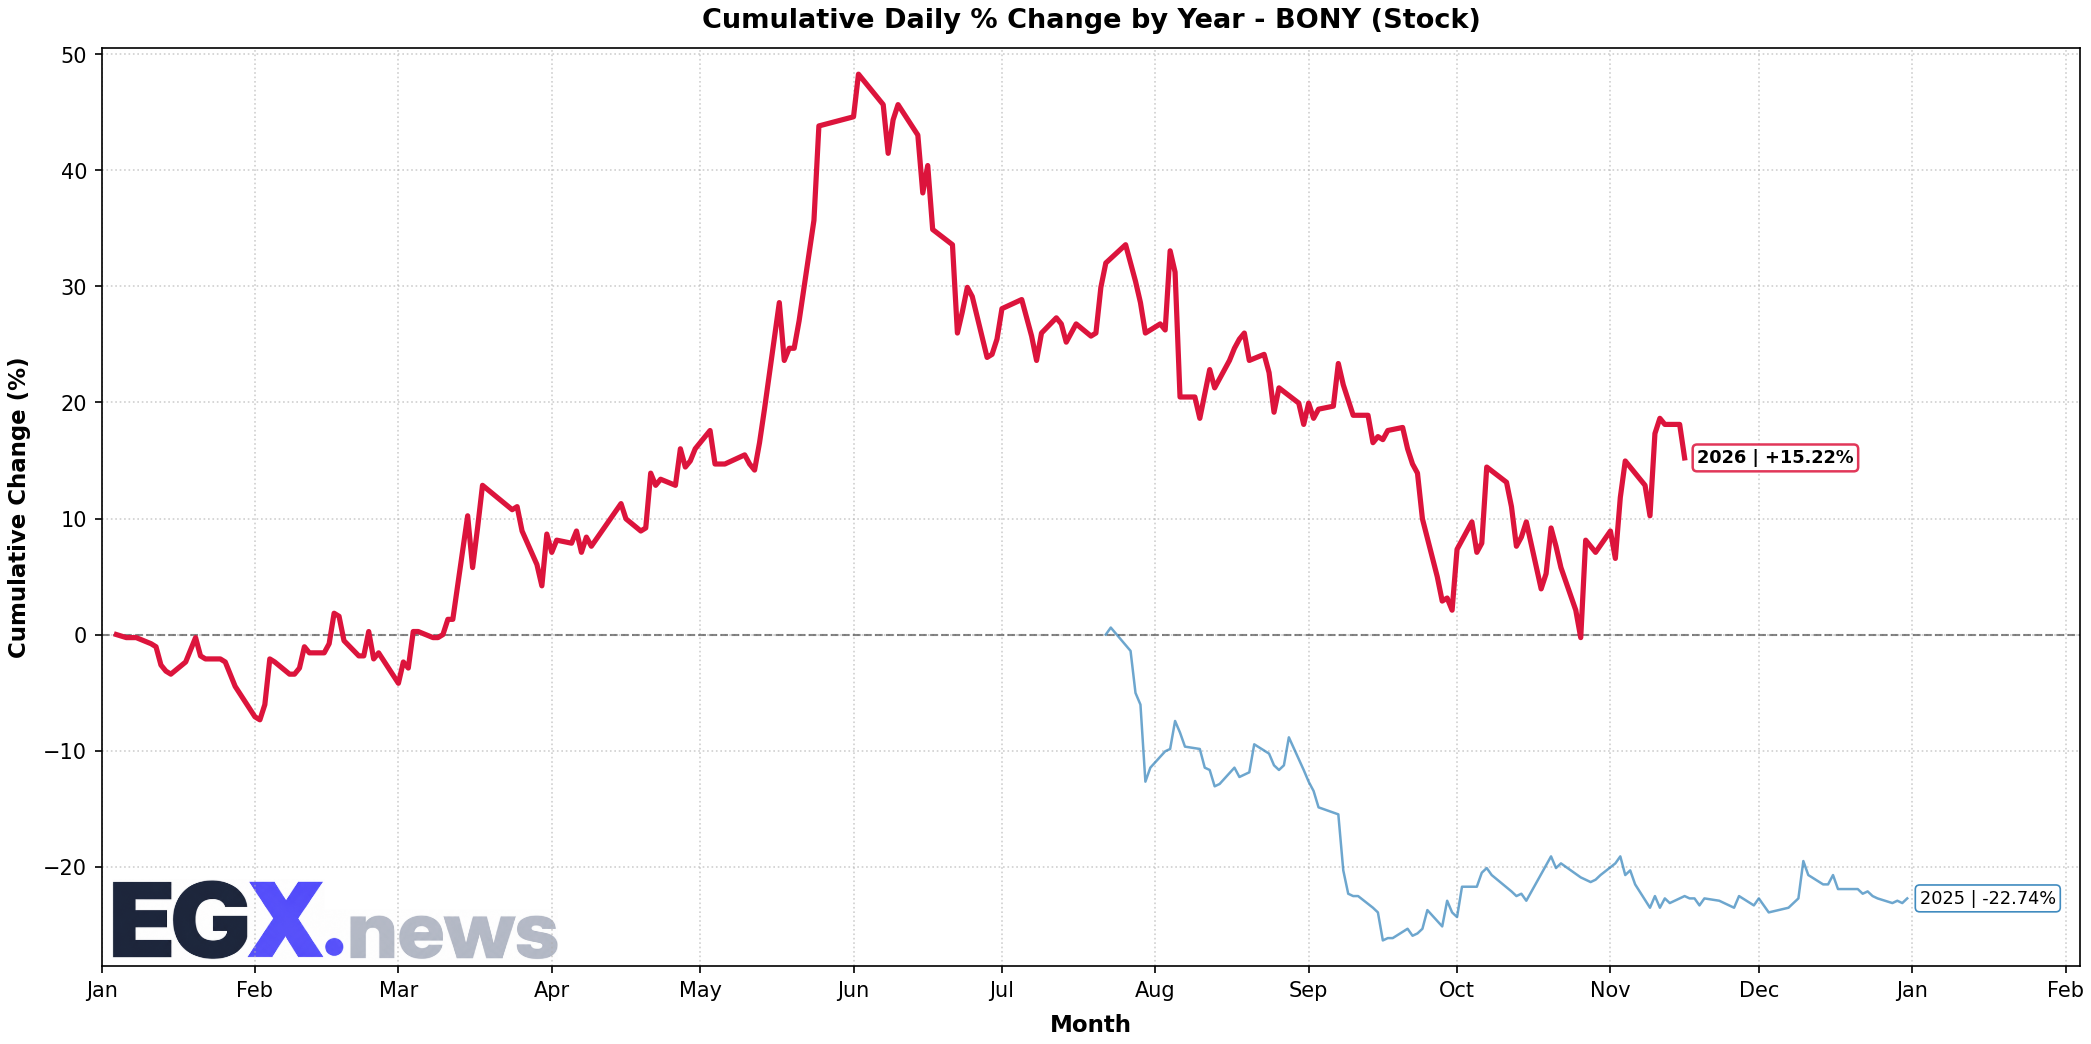
Click to EnlargeHistorical monthly seasonal return distribution and performance cycles for BONY.
Trend Structure & Moving Averages
Trend Score is 55/100 with price trading 4.03% above its 20-day SMA and above the 200-day long-term benchmark (SMA50 is below SMA200).
Momentum, Volume Flow & Volatility
RSI(14) is 54.81 (Bullish Momentum), moving +4.28 over the past 5 sessions — indicating positive momentum in buyer territory. MACD line (0.074) is above signal line (0.035) with a histogram of +0.039 (Bullish Momentum).
20-day annualized volatility is 51.36%, ATR(14) is 0.18 (4.1% of price), and price is trading in the middle channel (%B: 0.707, Bandwidth: 19.43%).
Statistical Backtests & Historical Win Rates
BacktestedEmpirical backtesting reveals that RSI oversold dips (<30) historically yield an average 20-day return of +1.08% with a 66.67% win rate (6 observations, Reliability: Very Low), while volume spikes yield an average 20-day return of -1.68% (43.75% win rate).
Price sits 23.92% below All-Time High (5.77 set 110 sessions ago on 2026-06-02) and 23.92% below its 52-week high (5.77 on 2026-06-02).