


Cairo Oils & Soap
COSGCairo Oils & Soap
Company Overview & Activities
* تصنيع وتجارة واستيراد وتصدير وتخزين وتبخير وصيانة وتعبئة ونقل وتوزيع البذور بانواعها و منتجاتها و بدائلها, عصر بذرة القطن لانتاج زيت الطعام و الكسب و الأسيتارين * استخلاص بذرة فول الصويا و انتاج زيت و كسب الصويا و كسب الصويا كامل الدسم. * هدرجة الزيوت و انتاج المسلى الصناعى - انتاج الصابون بانواعة و الجلسرين و المنظفات الصناعية و انتاج الاعلاف بانواعها - عصر و استخلاص الزيوت من البذور الزيتية و مكونات الاعلاف و الكسب و الزيوت النباتية و الصابون و المنظفات الصناعية - استيراد كافة الانواع المذكورة للشركة او الغير - مواد التعبئة و التغليف و المعدات الراسمالية و قطع الغيار اللازمة لها او المتصلة بهذه الاغراض و اية انشطة مكملة او ملحقة تكفل استغلال الطاقة المتاحة و ذلك لحسابها او لحساب الغير بمعرفتها ,,, تشقق و تقطير الزيوت النباتية و انتاج الاحماض الدهنية و مركزات الاعلاف السائلة و اعادة تصنيع و تدوير الزيوت النباتية المستخدمة لانتاج انواع من الوقود و الاتجار في هذه المنتجات و الخامات اللازمة لها – تخزين و تجارة و تداول الزيوت النباتية و المواد الكيمائية لحساب الشركة او للغير
EGS30581C010
1999-05-05
FRA Certified Auditor
Financial FAQ & Technical Outlook for Cairo Oils & Soap (COSG)
Quantitative Technical Engine (COSG)
Cairo Oils & Soap holds a Neutral technical posture (Overall Score: 47.8/100) with Trend Score 15/100, Momentum Score 80/100 (RSI 45.85 - Neutral), and Volume Score 70/100 (accumulating, 0.77x 20D baseline).
Support & Resistance Confluence Matrix
AlgorithmicNearest support is at 1.34 [Strength: 45.0/100, Tier 3 (Intraday 1-min)] (0.74% below price with a 100.0% confirmed bounce rate across 1 tests, Reliability: Low). Nearest resistance is at 1.36 [Strength: 82.0/100, Tier 1 (Macro 500D)] (0.74% above price with a 88.2% confirmed rejection rate across 17 tests, Reliability: High).
Seasonal Trend & Historical Patterns (COSG)
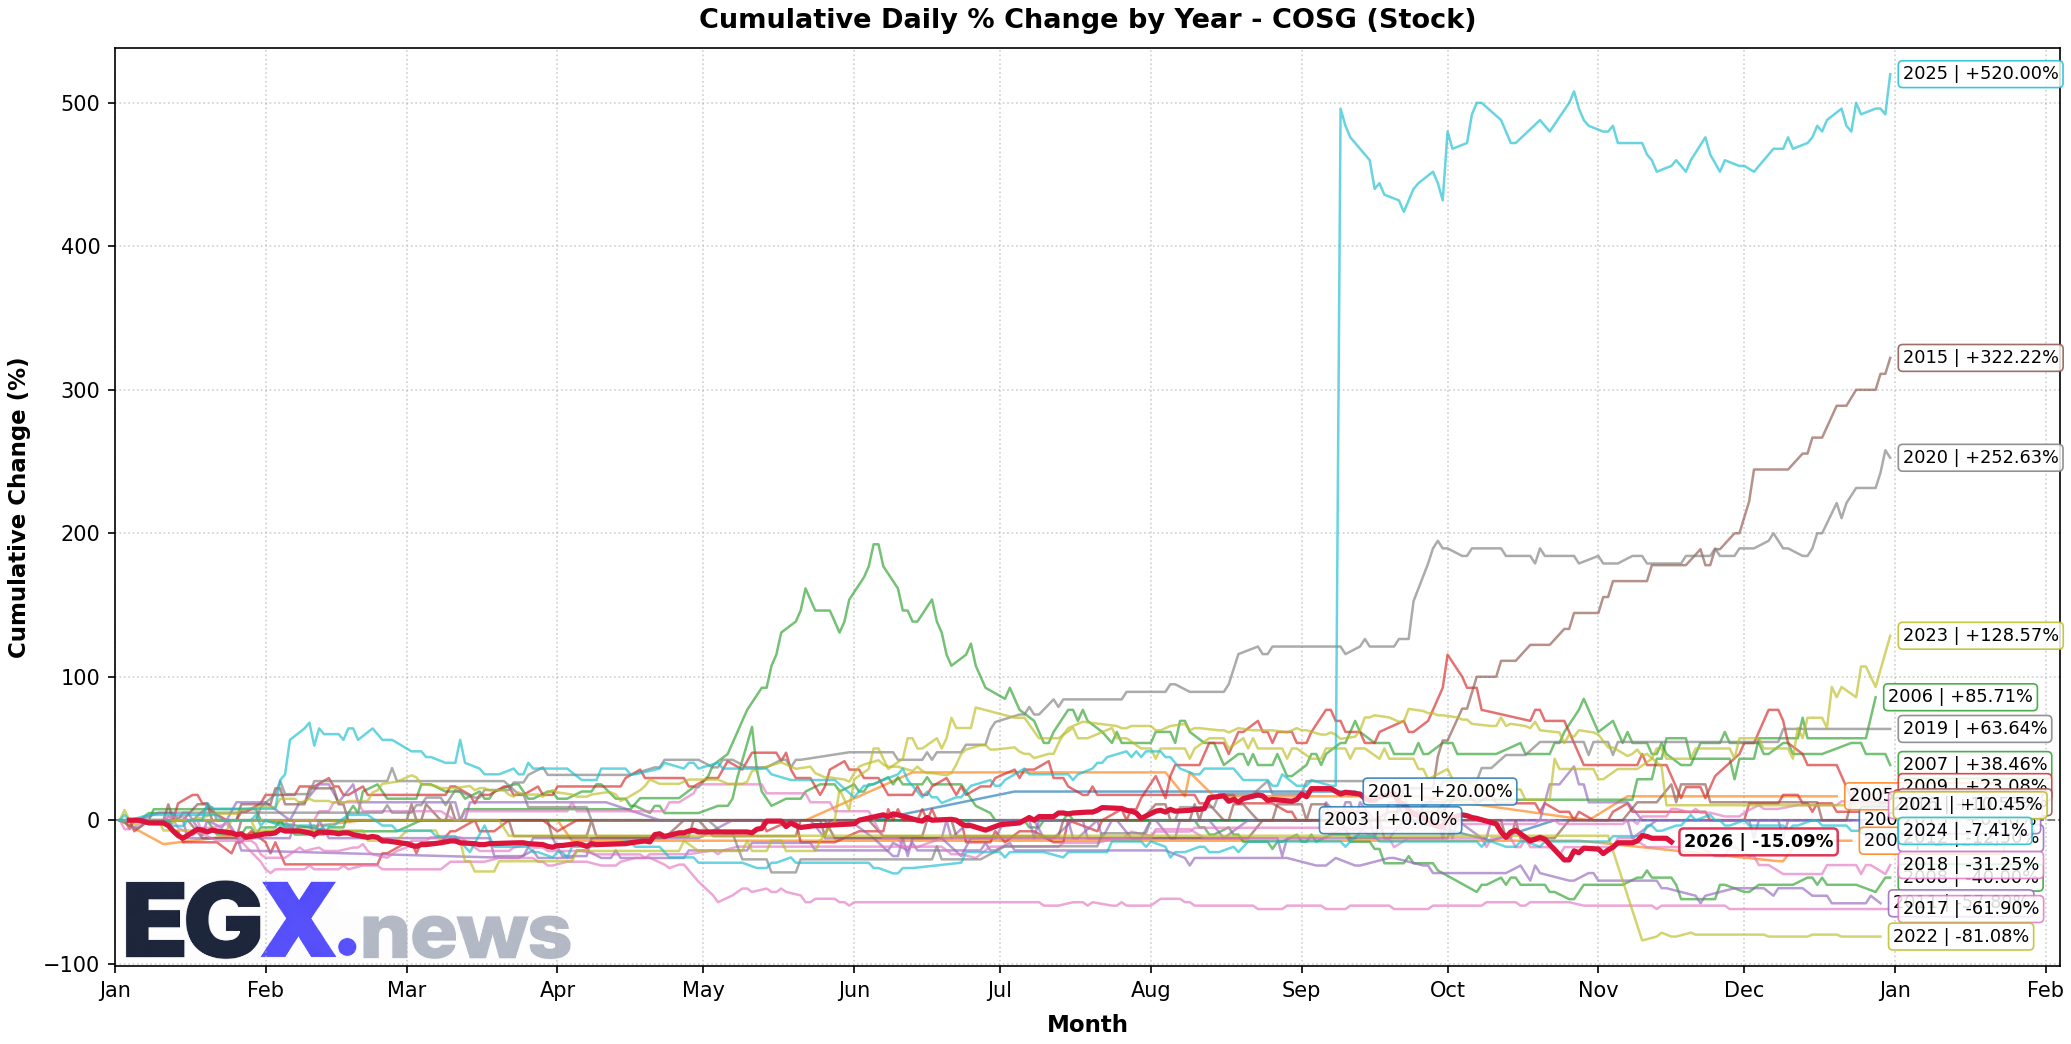
Click to EnlargeHistorical monthly seasonal return distribution and performance cycles for COSG.
Trend Structure & Moving Averages
Trend Score is 15/100 with price trading 3.05% above its 20-day SMA and below the 200-day long-term benchmark (SMA50 is below SMA200).
Momentum, Volume Flow & Volatility
RSI(14) is 45.85 (Neutral), moving -1.47 over the past 5 sessions — indicating a balanced / consolidation posture. MACD line (-0.03) is above signal line (-0.056) with a histogram of +0.026 (Bullish Momentum).
20-day annualized volatility is 69.45%, ATR(14) is 0.06 (4.44% of price), and price is trading in the middle channel (%B: 0.625, Bandwidth: 24.43%).
Statistical Backtests & Historical Win Rates
BacktestedEmpirical backtesting reveals that RSI oversold dips (<30) historically yield an average 20-day return of -2.73% with a 21.71% win rate (152 observations, Reliability: High), while volume spikes yield an average 20-day return of +3.20% (39.18% win rate).
Price sits 32.5% below All-Time High (2.0 set 50 sessions ago on 2026-09-06) and 32.5% below its 52-week high (2.0 on 2026-09-06).