


Canal Shipping Agencies
CSAGCanal Shipping Agencies Co.
Company Overview & Activities
القيام بكافة أعمال الوكالة البحرية " أمين السفينة و أمين الحمولة " والسمسار البحري و أعمال و نشاط السياحة العامة فئة (أ) و بيع تذاكر الطيران و السفن و الوكالة عن شركات الطيران و الملاحة و شركات النقل الأخرى و الرحلات و التخليص الجمركي و مناولة البضائع و القيام باعمال النقل البحري و البري في داخل و خارج البلاد و تملك و تاجير و استئجار وادارة وتشغيل السفن و النقلات و المهمات العائمة و كافة وسائل النقل و كذا تقديم كافة خدمات النقل للبضائع و الأشخاص داخل البلاد او خارجها ، و يجوز للشركة ان تشارك باي وجه من الوجوه او تشتري أيا من الجهات التي تزاول اعمالا شبيهة بنشاطها او التي تعاونها علي تحقيق أغرضها في جمهورية مصر العربية أو الخارج ، و للشركة الحق في تقديم كافة الخدمات اللوجيستية و تشغيل و إدارة المناطق اللوجيستية و الساحات منفردا او الاشتراك مع التخزين للغير. او أي نشاط استثماري يكون مكمل او مرتبط بنشاطها الأساسي و لا يجوز للشركة المساهمة في انشاء شركات او المشاركة فيها الا بموافقة الجمعية العامة للشركة .
EGS44031C010
1995-02-27
FRA Certified Auditor
Financial FAQ & Technical Outlook for Canal Shipping Agencies Co. (CSAG)
Quantitative Technical Engine (CSAG)
Canal Shipping Agencies holds a Bullish technical posture (Overall Score: 67.5/100) with Trend Score 50/100, Momentum Score 90/100 (RSI 54.77 - Bullish Momentum), and Volume Score 70/100 (accumulating, 1.27x 20D baseline).
Support & Resistance Confluence Matrix
AlgorithmicNearest support is at 35.57 [Strength: 65.0/100, Tier 3 (Intraday 1-min)] (1.19% below price with a 100.0% confirmed bounce rate across 41 tests, Reliability: High). Nearest resistance is at 36.1 [Strength: 45.0/100, Tier 3 (Intraday 1-min)] (0.28% above price with a 100.0% confirmed rejection rate across 1 tests, Reliability: Low).
Seasonal Trend & Historical Patterns (CSAG)
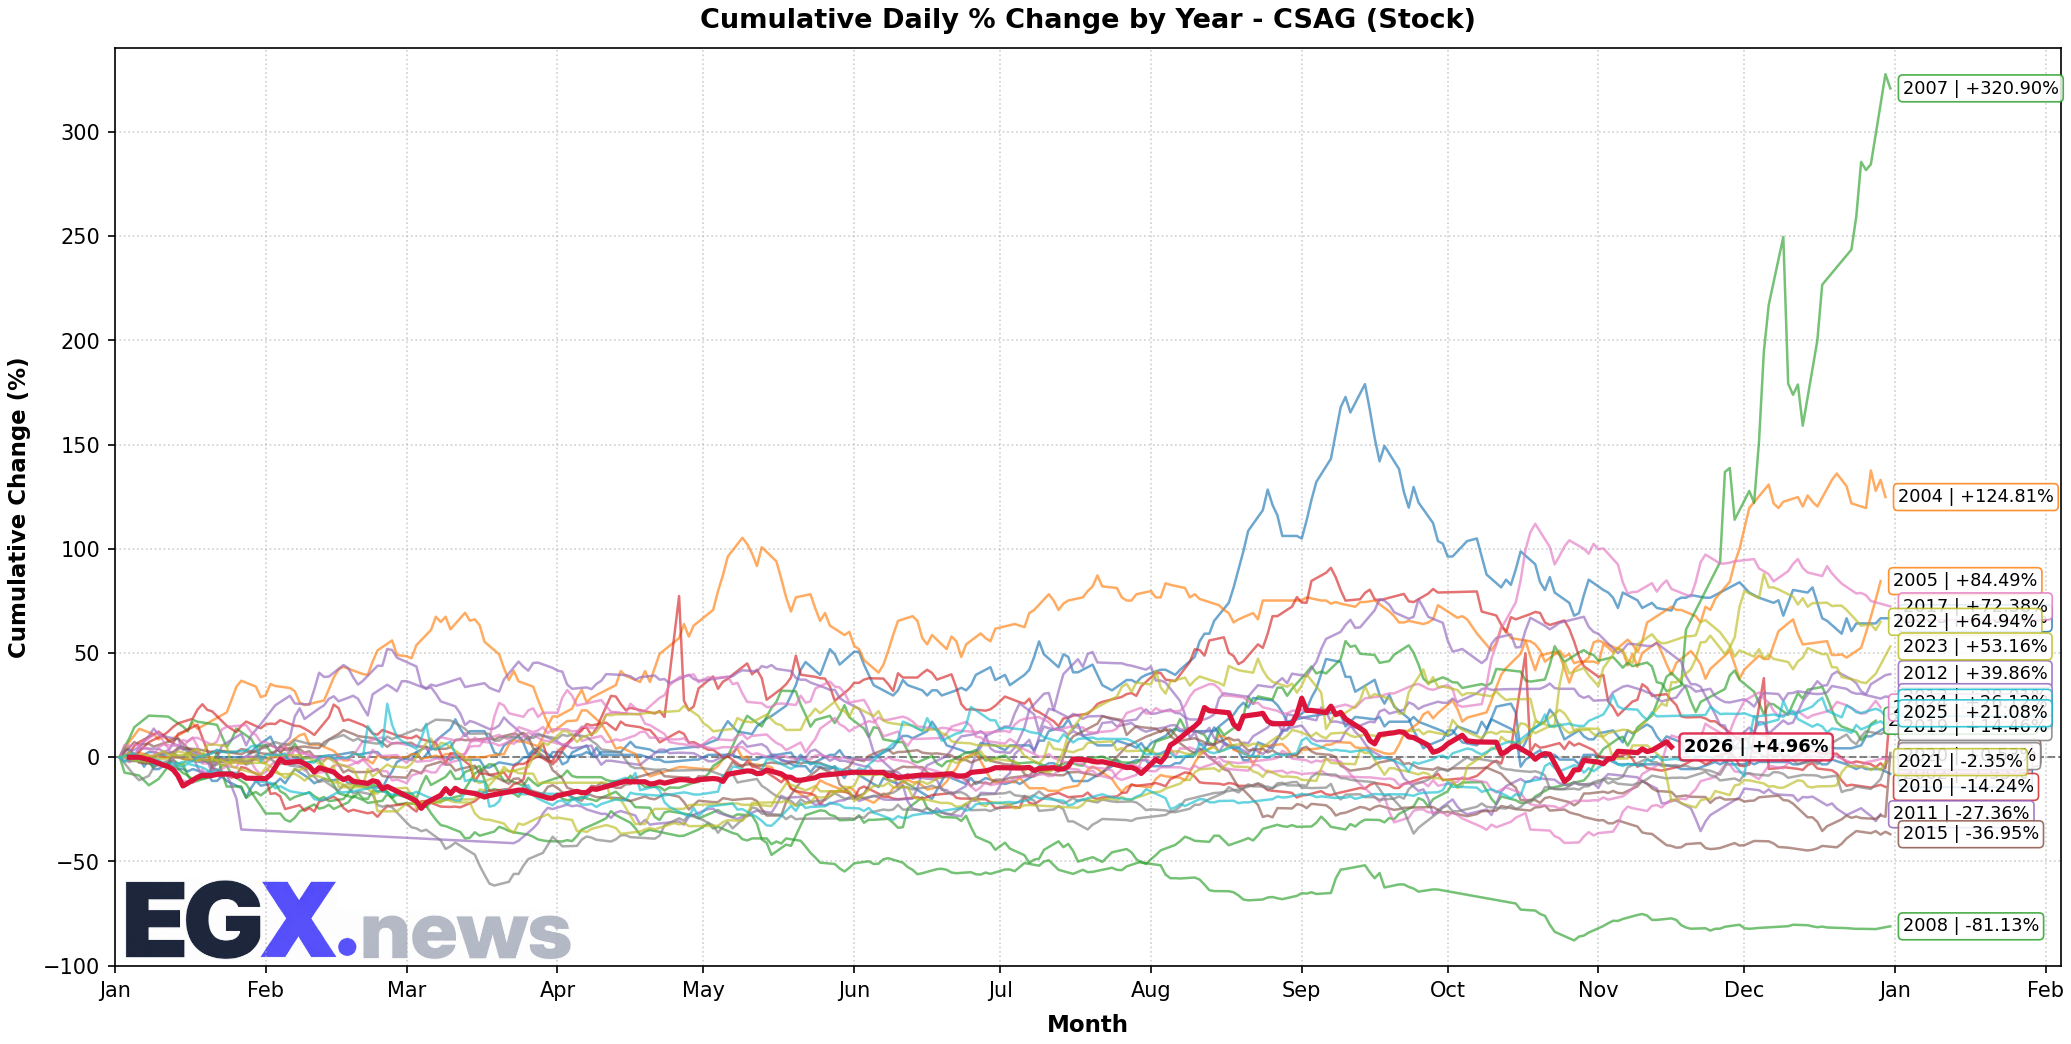
Click to EnlargeHistorical monthly seasonal return distribution and performance cycles for CSAG.
Trend Structure & Moving Averages
Golden Cross (88D)Trend Score is 50/100 with price trading 5.39% above its 20-day SMA and above the 200-day long-term benchmark (SMA50 is above SMA200 for 88 sessions).
Momentum, Volume Flow & Volatility
RSI(14) is 54.77 (Bullish Momentum), moving +3.33 over the past 5 sessions — indicating positive momentum in buyer territory. MACD line (0.094) is above signal line (-0.342) with a histogram of +0.436 (Bullish Momentum).
20-day annualized volatility is 58.37%, ATR(14) is 1.49 (4.14% of price), and price is trading in the middle channel (%B: 0.773, Bandwidth: 19.73%).
Statistical Backtests & Historical Win Rates
BacktestedEmpirical backtesting reveals that RSI oversold dips (<30) historically yield an average 20-day return of +4.56% with a 55.05% win rate (109 observations, Reliability: High), while volume spikes yield an average 20-day return of +4.94% (55.68% win rate).
Price sits 19.01% below All-Time High (44.45 set 52 sessions ago on 2026-09-02) and 19.01% below its 52-week high (44.45 on 2026-09-02).