


Creast
CRSTCreast Mark For Contracting And Real Estate Development
Company Overview & Activities
تطوير صناعة البناء و التشييد باستخدام اساليب حديثة لتنفيذ المنشات و ذلك بتطويع قوى الدفع الهيدروليكية في رفع الاسقف و الشدات المنزلقة و الرفع و التنزيل الثقيل و ايضا في تنفيذ الانفاق و العديات للمواسير و جميع الحلول الهندسية المستخدمة لاسلوب الدفع الهيدروليكي و كل ما يلحق بهذا النشاط و يتعلق به و البنية الاساسية من مياه شرب و صرف و كهرباء وطرق و المتمثلة في :- ( أ ) اقامة و تشغيل و ادارة محطات تحلية و تكرير مياه الشرب و شبكات توزيعها و خطوط نقلها . ( ب ) اقامة او تشغيل و ادارة محطات الصرف الصحي او الصرف الصناعي و التنقية و توصيلاتها . - اقامه وبناء العقارات بجميع مستوياتها وانواعها او بيعها او تاجيرها - اقامه وبناء القرى والمنشأت والمحلات السياحيه او استغلالها واقامه المدن السكنيه والمخيمات الاداريه . - القيام باعمال المقاولات بكافه انواعها واعمال شراء الاراضى وتقسيمها وتزويدها بالمرافق وبيعها او البناء عليها . - شراء الاراضى الزراعيه والصحراويه واستصلاحها وتقسيمها وادارتها او بيعها سواء قبل الاستزراع او بعد - ويجوز للشركة أن تكون لها مصلحة أو تشترك باى وجه من الوجوه من اله
EGS23141C012
1999-08-11
FRA Certified Auditor
Financial FAQ & Technical Outlook for Creast Mark For Contracting And Real Estate Development (CRST)
Quantitative Technical Engine (CRST)
Creast holds a Neutral technical posture (Overall Score: 43.8/100) with Trend Score 35/100, Momentum Score 60/100 (RSI 42.05 - Neutral), and Volume Score 45/100 (accumulating, 1.9x 20D baseline).
Support & Resistance Confluence Matrix
AlgorithmicNearest support is at 2.39 [Strength: 65.0/100, Tier 3 (Intraday 1-min)] (2.05% below price with a 100.0% confirmed bounce rate across 20 tests, Reliability: High). Nearest resistance is at 2.45 [Strength: 45.0/100, Tier 3 (Intraday 1-min)] (0.41% above price with a 100.0% confirmed rejection rate across 1 tests, Reliability: Low).
Seasonal Trend & Historical Patterns (CRST)
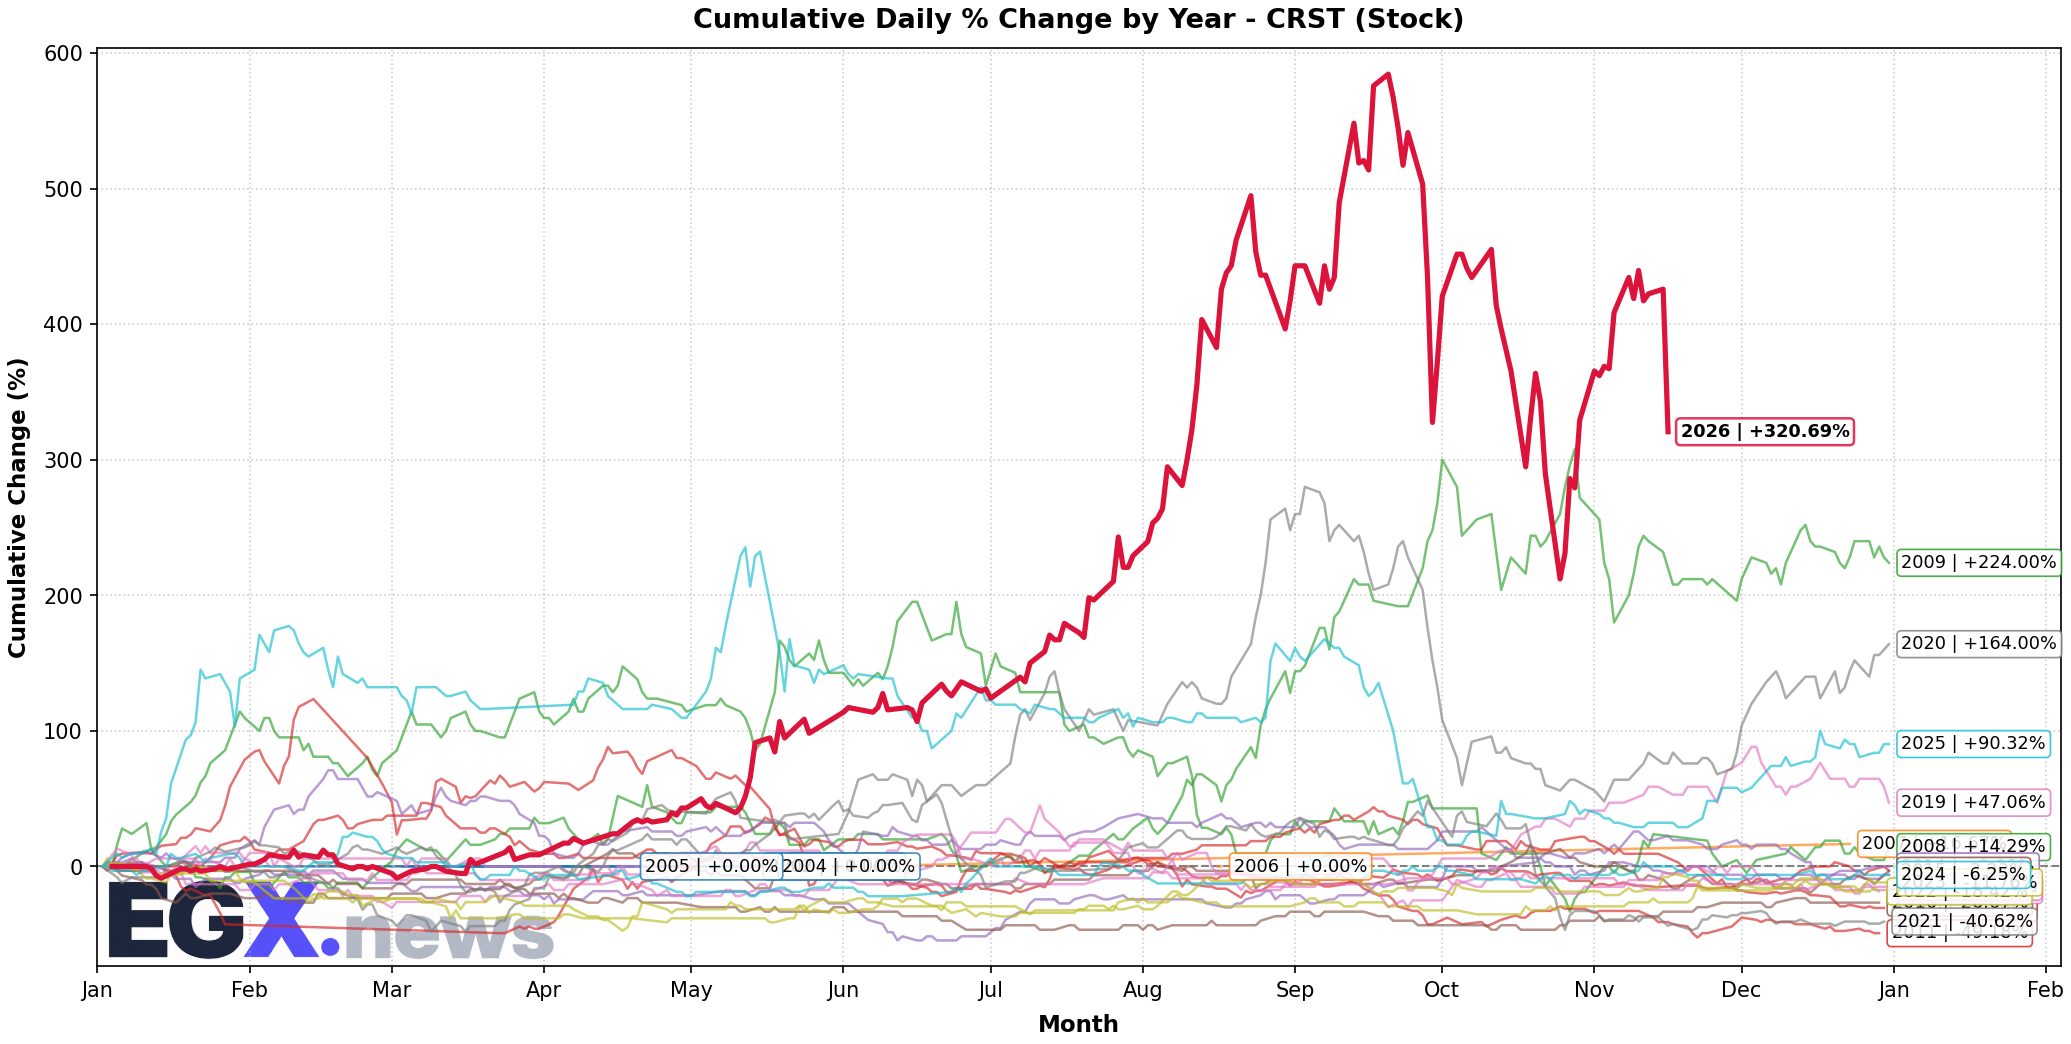
Click to EnlargeHistorical monthly seasonal return distribution and performance cycles for CRST.
Trend Structure & Moving Averages
Golden Cross (147D)Trend Score is 35/100 with price trading 7.58% below its 20-day SMA and above the 200-day long-term benchmark (SMA50 is above SMA200 for 147 sessions).
Momentum, Volume Flow & Volatility
RSI(14) is 42.05 (Neutral), moving -14.15 over the past 5 sessions — indicating a balanced / consolidation posture. MACD line (0.024) is above signal line (-0.008) with a histogram of +0.032 (Bullish Momentum).
20-day annualized volatility is 151.49%, ATR(14) is 0.28 (11.48% of price), and price is trading in the middle channel (%B: 0.376, Bandwidth: 59.47%).
Statistical Backtests & Historical Win Rates
BacktestedEmpirical backtesting reveals that RSI oversold dips (<30) historically yield an average 20-day return of +9.42% with a 58.88% win rate (107 observations, Reliability: High), while volume spikes yield an average 20-day return of +4.28% (44.19% win rate).
Price sits 40.34% below All-Time High (4.09 set 40 sessions ago on 2026-09-20) and 40.34% below its 52-week high (4.09 on 2026-09-20).