


Damietta Container and Cargo Handling
DCCCDamietta Container and Cargo Handling
Company Overview & Activities
تداول الحاويات و البضائع بانواعها بميناء دمياط ، و يتضمن شحن و تفريغ السفن ووسائل النقل المختلفة ، و كذا النقل الى الساحات و الملاحق و المستودعات و المخازن المخصصة لهذه النوعيات و اعمال المستودعات و التخزين و القيام بجميع العمليات الأخرى المتصلة بهذا الغرض ومزاولة نشاط التخزين و المستودعات ومزاولة نشاط التخليص الجمركي على البضائع الواردة و الصادرة و المملوكة للغير باعتبارها من الأنشطة المكملة لانشطة الشركة ، و يجوز ان تكون للشركة مصلحه او ان تشارك باى وجه من الوجوه مع الهيئات و الجهات التي تزاول اعمالا شبيه باعمالها او التي قد تعاونها على تحقيق غرضها في جمهورية مصر العربية و الخارج او تشتريها او تلحقها بها ، كما يجوز للشركة ان تقوم بالاستثمار في شركات و جهات تعمل في مجالات أخرى ، و لا يجوز للشركة المساهمة في انشاء شركات او المشاركة فيها الا بموافقة الجمعية العامة للشركة
EGS42121C011
2022-12-15
FRA Certified Auditor
Financial FAQ & Technical Outlook for Damietta Container and Cargo Handling (DCCC)
Quantitative Technical Engine (DCCC)
Damietta Container and Cargo Handling holds a Very Bearish technical posture (Overall Score: 17.5/100) with Trend Score 0/100, Momentum Score 10/100 (RSI 31.61 - Bearish Momentum), and Volume Score 35/100 (distributing, 0.12x 20D baseline).
Support & Resistance Confluence Matrix
AlgorithmicNearest resistance is at 15.82 [Strength: 65.0/100, Tier 1 (Macro 500D)] (69.2% above price with a 100.0% confirmed rejection rate across 1 tests, Reliability: Low).
Seasonal Trend & Historical Patterns (DCCC)
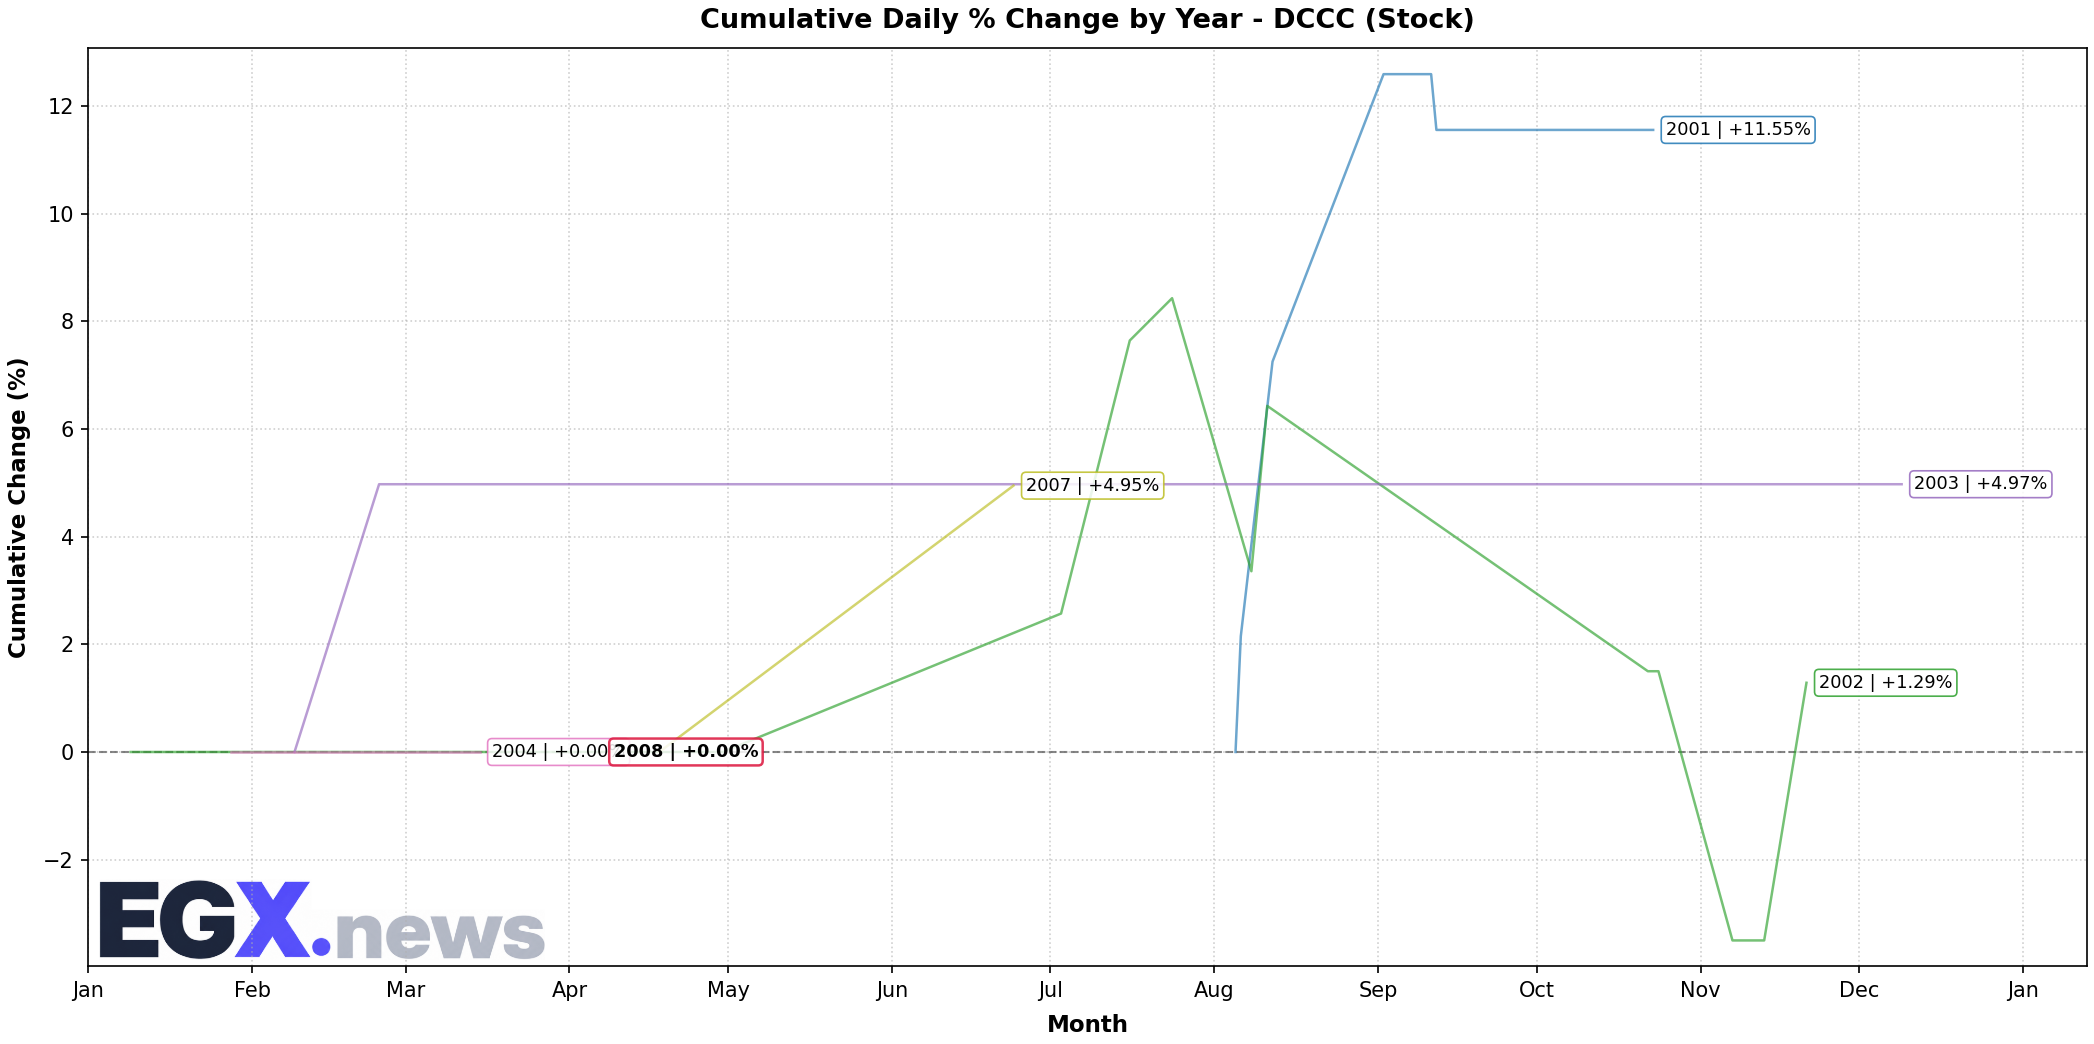
Click to EnlargeHistorical monthly seasonal return distribution and performance cycles for DCCC.
Trend Structure & Moving Averages
Trend Score is 0/100 with price trading 33.31% below its 20-day SMA (SMA50 is below SMA200).
Momentum, Volume Flow & Volatility
RSI(14) is 31.61 (Bearish Momentum), moving -47.14 over the past 5 sessions — reflecting persistent selling pressure. MACD line (-0.632) is below signal line (0.109) with a histogram of -0.740 (Bearish Momentum).
20-day annualized volatility is 183.77%, ATR(14) is 0.92 (9.84% of price), and price is trading near the lower band (%B: 0.01, Bandwidth: 68.12%).
Statistical Backtests & Historical Win Rates
BacktestedEmpirical backtesting reveals that RSI oversold dips (<30) historically yield an average 20-day return of +0.00% with a 0% win rate (0 observations, Reliability: Low), while volume spikes yield an average 20-day return of +0.00% (0% win rate).
Price sits 45.7% below All-Time High (17.22 set 4 sessions ago on 2004-03-10) and 45.7% below its 52-week high (17.22 on 2004-03-10).