


East Delta Flour Mills
EDFMEast Delta Flour Mills Co.
Company Overview & Activities
تصنيع و تجارة و استيراد و تخزين و تبخير و صيانة و تعبئة و تجهيز و نقل و توزيع الحبوب بكافة أنواعها و منتجاتها و بدائلها و الخبز بكافة انواعة – المخبوزات – العجائن – المكرونة – المواد الغذائية بصفة عامة الاعلاف و مكوناتها – الخمائر – الثلج – التبريد و التجميد – مستلزمات التعبئة و التغليف – المعدات الراسمالية و قطع الغيار اللازمة لها و المتصلو بهذا الغرض – مستلزمات التشغيل و الإنتاج – مخلفات التشغيل و الإنتاج – اية أنشطة مكملة او ملحقة تكفل استغلال الطاقة المتاحة بالإضافة الى نشاط الاستثمار العقاري و ذلك كله لحسابها او لحساب الغير بمعرفتها او بمعرفة الغير في جمهورية مصر العربية او خارجها . و يجوز للشركة ان تكون لها مصلحة او تشترك باي وجه من الوجوه مع الشركات و الافراد و غيرها التي تزاول اعمالا شبيهة باعمالها او التي قد تعاونها على تحقيق غرضها في مصر او في الخارج كما يجوز لها ان تندمج في الهيئات السالفة او تشتريها او تلحقها بها و ذلك طبقا لاحكام القانون و لائحته التنفيذية ومع مراعاة احكام القوانين و اللوائح و القرارات السارية و بشرط استصدار التراخيص اللازمة لممارسة هذه الأنشطة .
EGS30351C018
1996-06-19
FRA Certified Auditor
Financial FAQ & Technical Outlook for East Delta Flour Mills Co. (EDFM)
Quantitative Technical Engine (EDFM)
East Delta Flour Mills holds a Neutral technical posture (Overall Score: 44.5/100) with Trend Score 20/100, Momentum Score 80/100 (RSI 41.91 - Neutral), and Volume Score 45/100 (accumulating, 2.01x 20D baseline).
Support & Resistance Confluence Matrix
AlgorithmicNearest support is at 354.44 [Strength: 45.0/100, Tier 3 (Intraday 1-min)] (1.57% below price with a 100.0% confirmed bounce rate across 1 tests, Reliability: Low). Nearest resistance is at 364.58 [Strength: 45.0/100, Tier 3 (Intraday 1-min)] (1.24% above price with a 100.0% confirmed rejection rate across 1 tests, Reliability: Low).
Seasonal Trend & Historical Patterns (EDFM)
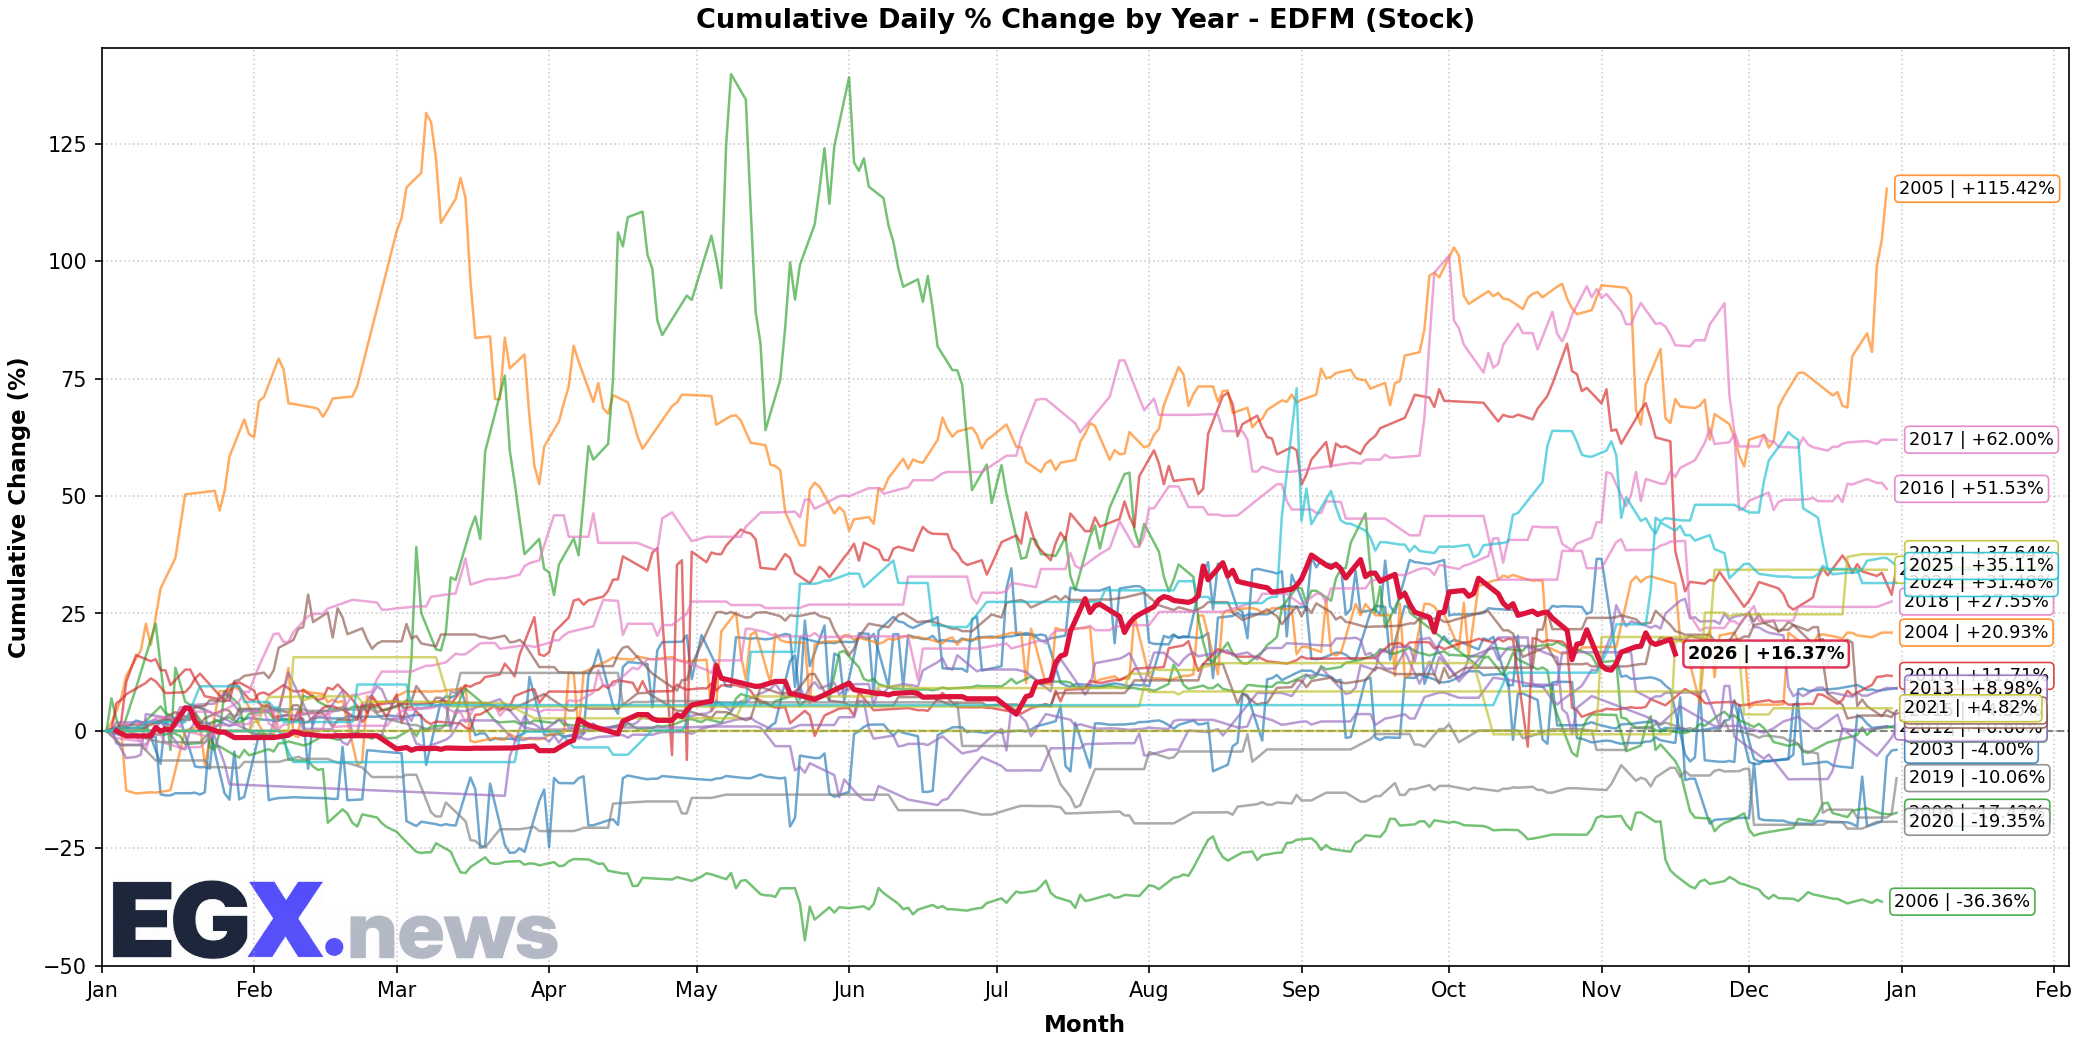
Click to EnlargeHistorical monthly seasonal return distribution and performance cycles for EDFM.
Trend Structure & Moving Averages
Golden Cross (113D)Trend Score is 20/100 with price trading 1.83% below its 20-day SMA and above the 200-day long-term benchmark (SMA50 is above SMA200 for 113 sessions).
Momentum, Volume Flow & Volatility
RSI(14) is 41.91 (Neutral), moving -1.81 over the past 5 sessions — indicating a balanced / consolidation posture. MACD line (-6.066) is above signal line (-7.552) with a histogram of +1.485 (Bullish Momentum).
20-day annualized volatility is 37.67%, ATR(14) is 14.18 (3.94% of price), and price is trading in the middle channel (%B: 0.354, Bandwidth: 12.54%).
Statistical Backtests & Historical Win Rates
BacktestedEmpirical backtesting reveals that RSI oversold dips (<30) historically yield an average 20-day return of +3.28% with a 60.4% win rate (101 observations, Reliability: High), while volume spikes yield an average 20-day return of +1.74% (54.31% win rate).
Price sits 23.38% below All-Time High (470.0 set 282 sessions ago on 2025-09-01) and 22.56% below its 52-week high (465.0 on 2026-09-07).