


Egypt for Poultry
EPCOEgypt for Poultry Co.
Company Overview & Activities
غرض الشركة هو : انتاج بيض تفريخ من انتاج الأمهات ، انتاج الكتاكيت من بيض تفريخ ، انتاج البدارى ( تربية التاكيت ) ،انتاج بيض مائدة من تربية دجاج بيض ، انتاج علف دواجن خلط مكونات أولية ، انشاء مجزر الى ، القيام بعمليات توزيغ منتجات الشركة في الداخل و الخارج و تصديرها ، انشاء غرفة تبريد لخدمة أغراض الشركة و تاجيرها للغير ، انشاء مصنع لانتاج ادوية الدواجن ، فتح فروع و منح توكيلات لبيع منتجات الشركة في انحاء جمهورية مصر العربية ، منح توكيلات في الخارج لتوزيع منتجات الشركة ، المشاركة في المشاريع المشابهه في الداخل و الخارج ، القيام بجميع عمليات الاستيراد في نطاق الأغراض السابقة ، استصلاح و استزراع الاراضى البور و الصحراوية و يشترط في هاتين الحالتين ان تكون الاراضى مخصصة لاغراض الاستصلاح و الاستزراع و ان تستخدم طرق الرى الحديثة للاستزراع و ليس الرى بطريق الغمر مع مراعاة احكام القوانين و اللوائح اللازمة لممارسة النشاط ، الإنتاج الحيوانى و السمكى ، النقل المبرد و المجمد للبضائع ، الاستثمار العقارى في نطاق مناطق المجتمعات العمرانية الحديدة ، و يجوز للشركة ان يكون لها مصلحه او تشترك باى وجه من ا
EGS02211C018
2001-12-06
FRA Certified Auditor
Financial FAQ & Technical Outlook for Egypt for Poultry Co. (EPCO)
Quantitative Technical Engine (EPCO)
Egypt for Poultry holds a Bullish technical posture (Overall Score: 61.0/100) with Trend Score 40/100, Momentum Score 80/100 (RSI 47.24 - Neutral), and Volume Score 70/100 (accumulating, 1.16x 20D baseline).
Support & Resistance Confluence Matrix
AlgorithmicNearest support is at 8.65 [Strength: 45.0/100, Tier 3 (Intraday 1-min)] (0.69% below price with a 100.0% confirmed bounce rate across 1 tests, Reliability: Low). Nearest resistance is at 8.88 [Strength: 45.0/100, Tier 3 (Intraday 1-min)] (1.95% above price with a 100.0% confirmed rejection rate across 1 tests, Reliability: Low).
Seasonal Trend & Historical Patterns (EPCO)
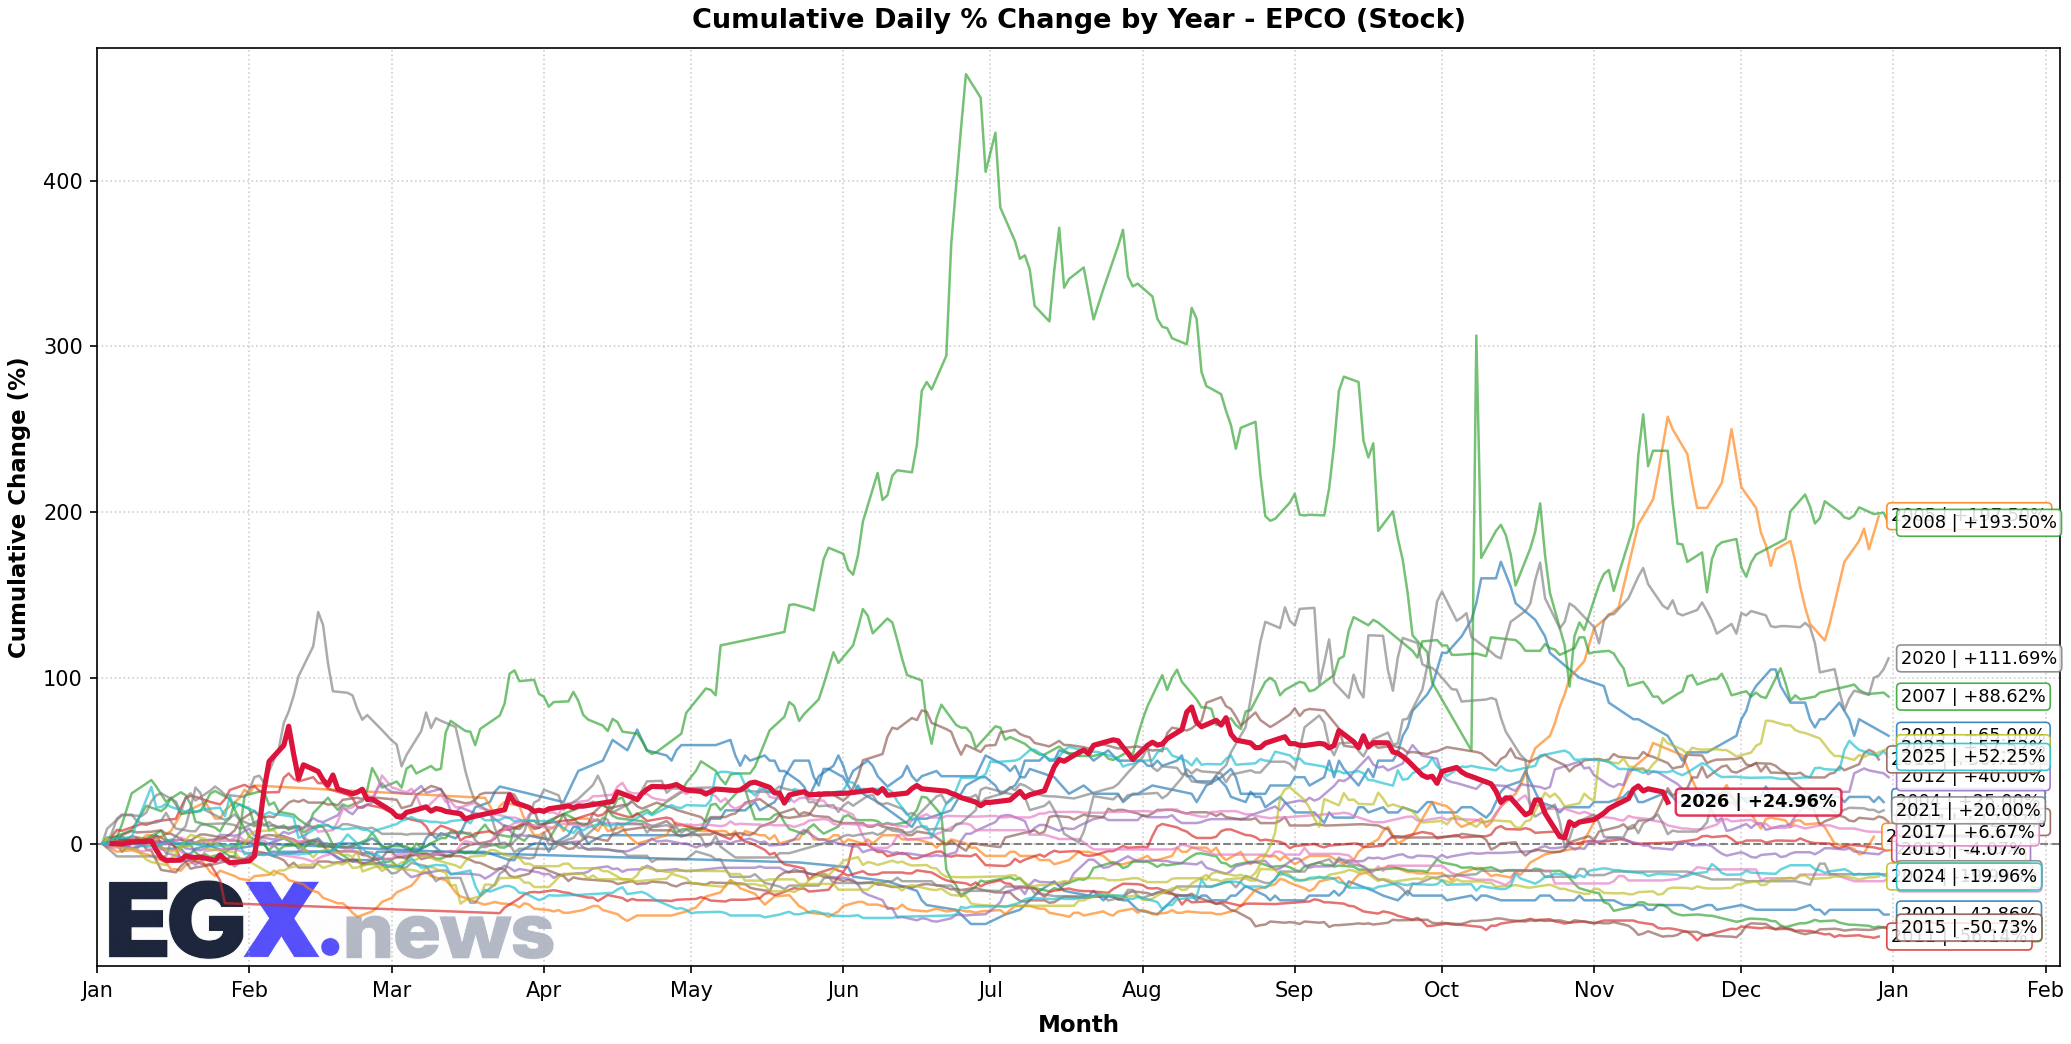
Click to EnlargeHistorical monthly seasonal return distribution and performance cycles for EPCO.
Trend Structure & Moving Averages
Golden Cross (486D)Trend Score is 40/100 with price trading 3.08% above its 20-day SMA and below the 200-day long-term benchmark (SMA50 is above SMA200 for 486 sessions).
Momentum, Volume Flow & Volatility
RSI(14) is 47.24 (Neutral), moving -9.46 over the past 5 sessions — indicating a balanced / consolidation posture. MACD line (-0.042) is above signal line (-0.208) with a histogram of +0.165 (Bullish Momentum).
20-day annualized volatility is 72.25%, ATR(14) is 0.58 (6.66% of price), and price is trading in the middle channel (%B: 0.601, Bandwidth: 31.12%).
Statistical Backtests & Historical Win Rates
BacktestedEmpirical backtesting reveals that RSI oversold dips (<30) historically yield an average 20-day return of +2.64% with a 45.13% win rate (113 observations, Reliability: High), while volume spikes yield an average 20-day return of +5.47% (53.75% win rate).
Price sits 41.7% below All-Time High (14.94 set 4396 sessions ago on 2008-06-29) and 36.19% below its 52-week high (13.65 on 2026-08-10).