


Egyptian Chemical Industries
EGCHEgyptian Chemical Industries
Company Overview & Activities
انتاج الأسمدة و المواد الكيماوية و الفيروسيليكون و نترات الامونيوم النقية و الثلج و تعبئة الاكسجين و اية منتجات اخري مرتبطة او مكملة لتلك المنتجات و الاتجار فيها بالذات او التوكيل و مباشرة جميع العمليات المالية و التجارية المتعلقة بها . و يجوز للشركة ان تزاول اية أنشطة اخري طالما هذا النشاط لازما و ضروريا لتحقيق مصالحها و مرتبطا باغرضها و اهدفها و ذو صلة بعملية استغلال مواردها علي الوحه الأمثل و علي الأخص في المجالات الاتية : المشاركة عن طريق الوكالة التجارية او الصناعية مع الهيئات و الشركات التي تزاول اعمالا شبيهة باعمالها او التي قد تعاونها علي تحقيق غرضها في الداخل و الخارج . مزاولة النشاط العقاري فيما يخص البيع او التشييد او المشاركة او الاتجار او الايجار مع الشركات المتخصصة في مجال التسويق العقاري " تشييد و بناء " . العهود من خلال عقود الإدارة الي الأشخاص المعنوية المتخصصة في إدارة و تأجير او تشغيل بعض المنشات المملوكة لها كالفنادق و المسارح و دور السينما . إدارة و تشغيل النوادي الاجتماعية المملوكة لها.
EGS38201C017
1995-08-16
FRA Certified Auditor
Financial FAQ & Technical Outlook for Egyptian Chemical Industries (EGCH)
Quantitative Technical Engine (EGCH)
Egyptian Chemical Industries holds a Neutral technical posture (Overall Score: 40.8/100) with Trend Score 15/100, Momentum Score 80/100 (RSI 43.13 - Neutral), and Volume Score 35/100 (distributing, 1.18x 20D baseline).
Support & Resistance Confluence Matrix
AlgorithmicNearest support is at 10.76 [Strength: 57.4/100, Tier 3 (Intraday 1-min)] (0.37% below price with a 69.7% confirmed bounce rate across 33 tests, Reliability: High). Nearest resistance is at 10.84 [Strength: 45.0/100, Tier 3 (Intraday 1-min)] (0.37% above price with a 100.0% confirmed rejection rate across 1 tests, Reliability: Low).
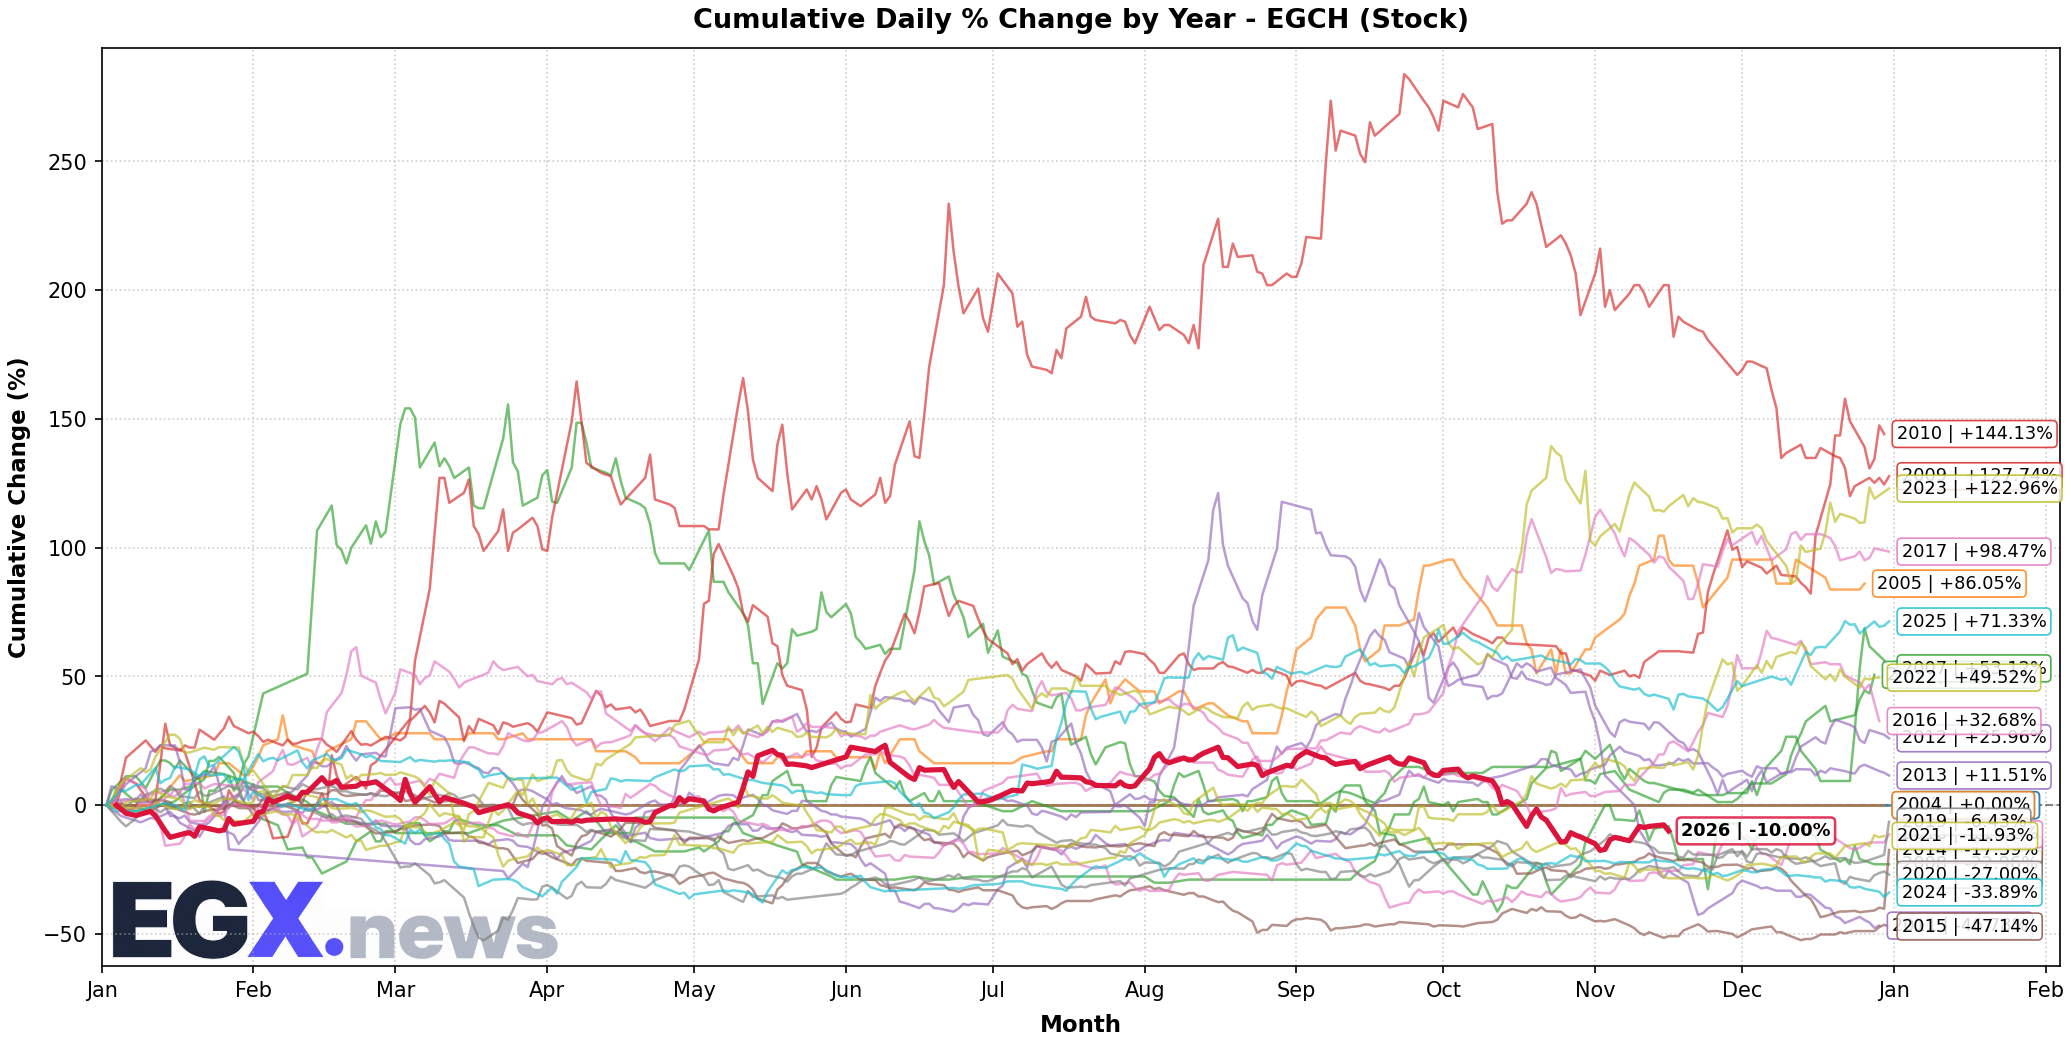
Seasonal Trend & Historical Patterns (EGCH)
Click to EnlargeHistorical monthly seasonal return distribution and performance cycles for EGCH.
Trend Structure & Moving Averages
Trend Score is 15/100 with price trading 1.03% above its 20-day SMA and below the 200-day long-term benchmark (SMA50 is below SMA200).
Momentum, Volume Flow & Volatility
RSI(14) is 43.13 (Neutral), moving +2.55 over the past 5 sessions — indicating a balanced / consolidation posture. MACD line (-0.383) is above signal line (-0.558) with a histogram of +0.175 (Bullish Momentum).
20-day annualized volatility is 49.75%, ATR(14) is 0.45 (4.17% of price), and price is trading in the middle channel (%B: 0.555, Bandwidth: 18.71%).
Statistical Backtests & Historical Win Rates
BacktestedEmpirical backtesting reveals that RSI oversold dips (<30) historically yield an average 20-day return of +3.93% with a 53.47% win rate (101 observations, Reliability: High), while volume spikes yield an average 20-day return of +3.76% (43.69% win rate).
Price sits 50.02% below All-Time High (21.61 set 3688 sessions ago on 2011-08-16) and 27.9% below its 52-week high (14.98 on 2026-05-18).