


Egyptian Financial & Industrial
EFICEgyptian Financial & Industrial Co.
Company Overview & Activities
1.القيام بنفسها او عن طريق الاشتراك مع غيرها بأية كيفية كانت بانتاج وتصنيع المواد الكيماوية والاسمدة والمخصبات الزراعية بكافة انواعها سواء البودرة المحببة والورقية والسائلة او الاتجار فيها . 2.تصنيع اكياس من البلاستيك او الاكياس عموما اللازمة لتعبئة انتاجها ولها ايضا توريد او صنع اكياس للغير ان الطاقة الانتاجية تسمح بذلك . 3.تملك او المشاركة فى تملك وسائل النقل البرى او النهرى وذلك لنقل المنتجات التى تصنعها او المواد التى تستعملها الشركة ولها ايضا تاجير او استعمال تلك الوسائل فى نقل البضائع او مهمات الغير مما يعود عليها بالنفع وتحسين اقتصاديات الشركة . 4.القيام بالاعمال الخاصة بالمنقول والعقار وكافة العمليات الصناعية والمالية والتجارية واستغلال الاموال المتاحة للشركة بمايعود بالنفع عليها وعلى العموم كافة العمليات التى لها صلة باغراض الشركة سالفة الذكر . 5.انشاء او الاشتراك فى المشروعات الاستثمارية فى الصناعات الاساسية او التكميلية سواء كانت مشروعات مستقلة او مشروعات مشتركة بما يتفق مع نشاط الشركة . 6.شراء او استيراد كافة المواد الخام ومستلزمات الانتاج اللازمة لها لمزاولة نش
EGS38381C017
1996-03-10
FRA Certified Auditor
Financial FAQ & Technical Outlook for Egyptian Financial & Industrial Co. (EFIC)
Quantitative Technical Engine (EFIC)
Egyptian Financial & Industrial holds a Bullish technical posture (Overall Score: 60.5/100) with Trend Score 30/100, Momentum Score 90/100 (RSI 53.18 - Bullish Momentum), and Volume Score 70/100 (accumulating, 0.69x 20D baseline).
Support & Resistance Confluence Matrix
AlgorithmicNearest support is at 162.46 [Strength: 77.5/100, Tier 1 (Macro 500D)] (1.02% below price with a 70.0% confirmed bounce rate across 10 tests, Reliability: High). Nearest resistance is at 167.34 [Strength: 45.0/100, Tier 3 (Intraday 1-min)] (1.96% above price with a 100.0% confirmed rejection rate across 1 tests, Reliability: Low).
Seasonal Trend & Historical Patterns (EFIC)
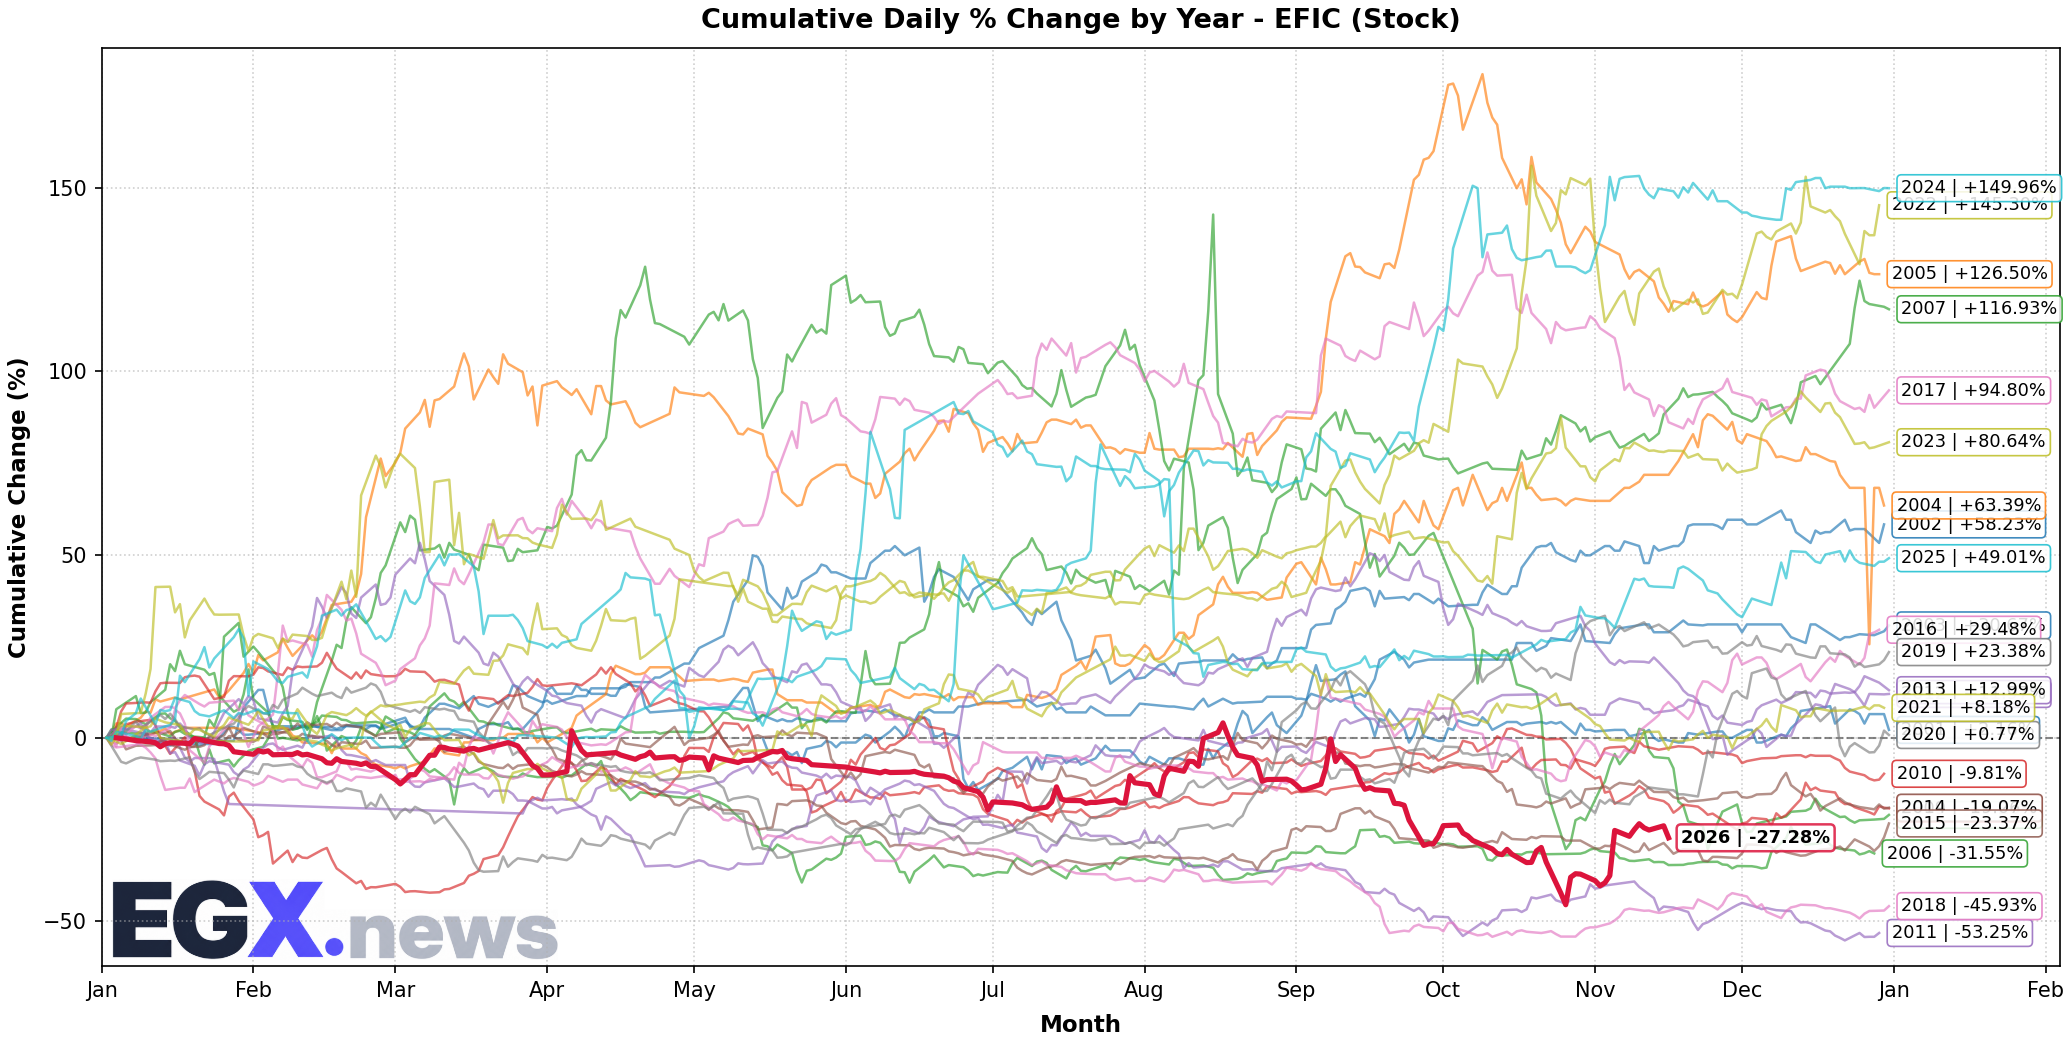
Click to EnlargeHistorical monthly seasonal return distribution and performance cycles for EFIC.
Trend Structure & Moving Averages
Trend Score is 30/100 with price trading 7.99% above its 20-day SMA and below the 200-day long-term benchmark (SMA50 is below SMA200).
Momentum, Volume Flow & Volatility
RSI(14) is 53.18 (Bullish Momentum), moving -5.37 over the past 5 sessions — indicating positive momentum in buyer territory. MACD line (2.079) is above signal line (-1.779) with a histogram of +3.858 (Bullish Momentum).
20-day annualized volatility is 108.54%, ATR(14) is 9.22 (5.62% of price), and price is trading in the middle channel (%B: 0.688, Bandwidth: 42.44%).
Statistical Backtests & Historical Win Rates
BacktestedEmpirical backtesting reveals that RSI oversold dips (<30) historically yield an average 20-day return of +0.93% with a 47.29% win rate (129 observations, Reliability: High), while volume spikes yield an average 20-day return of +2.45% (54.64% win rate).
Price sits 42.0% below All-Time High (283.0 set 308 sessions ago on 2025-07-27) and 36.87% below its 52-week high (260.0 on 2026-08-17).