


Egyptian Media Production City
MPRCEgyptian Media Production City
Company Overview & Activities
-توفير وسائل إنتاجية يمكن تاجيرها او بيعها للغير للأغراض التليفزيونية و السينمائية و الإعلامية بما في ذلك الأنشطة المكملة لها بشرط ان يكون بيع السلع المخزونة الى الشركات العاملة بمدينة الإنتاج الاعلامى فقط و ان تلتزم الشركة بالشروط الخاصة بنشاط التخزين و في حالة رغبة الشركات الغير عاملة بنظام المناطق الحرة داخل المنطقة الحرة العامة الإعلامية شراء احدى احتياجاتها من الشركة المصرية لمدينة الإنتاج الاعلامى و الخاصة بهذا النشاط الالتزام بسداد كافة الضرائب و الرسوم المستحقه عليها لعدم تمتع تلك الشركات بمزايا المنطقة الحرة العمة . -توفير انتاج متنوع ( درامى – ثقافى – أطفال ) . -التوزيع و التسويق لانتاج الشركة و انتاج الغير . -توفير و تصنيع احتياجات المدينة ( مشغولات خشبية – معدنية – ملابس – اكسسوارات لغرض الشركة ) من خلال مجمع الخدمات المنشأ لهذا الغرض او غيره و تاجيرها او بيعها للغير . -إقامة فنادق داخل المدينة لتقديم الخدمات الفندقية للوافدين على مدينة السادس من أكتوبر و السائحين و الفنانين . -مشاركة و تمويل و إدارة و تشغيل شركات عالية و محلية في كافة الأنشطة التي تحقق أغراض الش
EGS78021C010
1999-09-26
FRA Certified Auditor
Financial FAQ & Technical Outlook for Egyptian Media Production City (MPRC)
Quantitative Technical Engine (MPRC)
Egyptian Media Production City holds a Very Bullish technical posture (Overall Score: 80.2/100) with Trend Score 65/100, Momentum Score 100/100 (RSI 57.48 - Bullish Momentum), and Volume Score 70/100 (accumulating, 0.58x 20D baseline).
Support & Resistance Confluence Matrix
AlgorithmicNearest support is at 38.54 (Volume Profile POC Anchor) [Strength: 60.0/100, Tier 3 (Intraday 1-min)] (0.34% below price with a 100.0% confirmed bounce rate across 1 tests, Reliability: Low). Nearest resistance is at 39.14 [Strength: 45.0/100, Tier 3 (Intraday 1-min)] (1.22% above price with a 100.0% confirmed rejection rate across 1 tests, Reliability: Low).
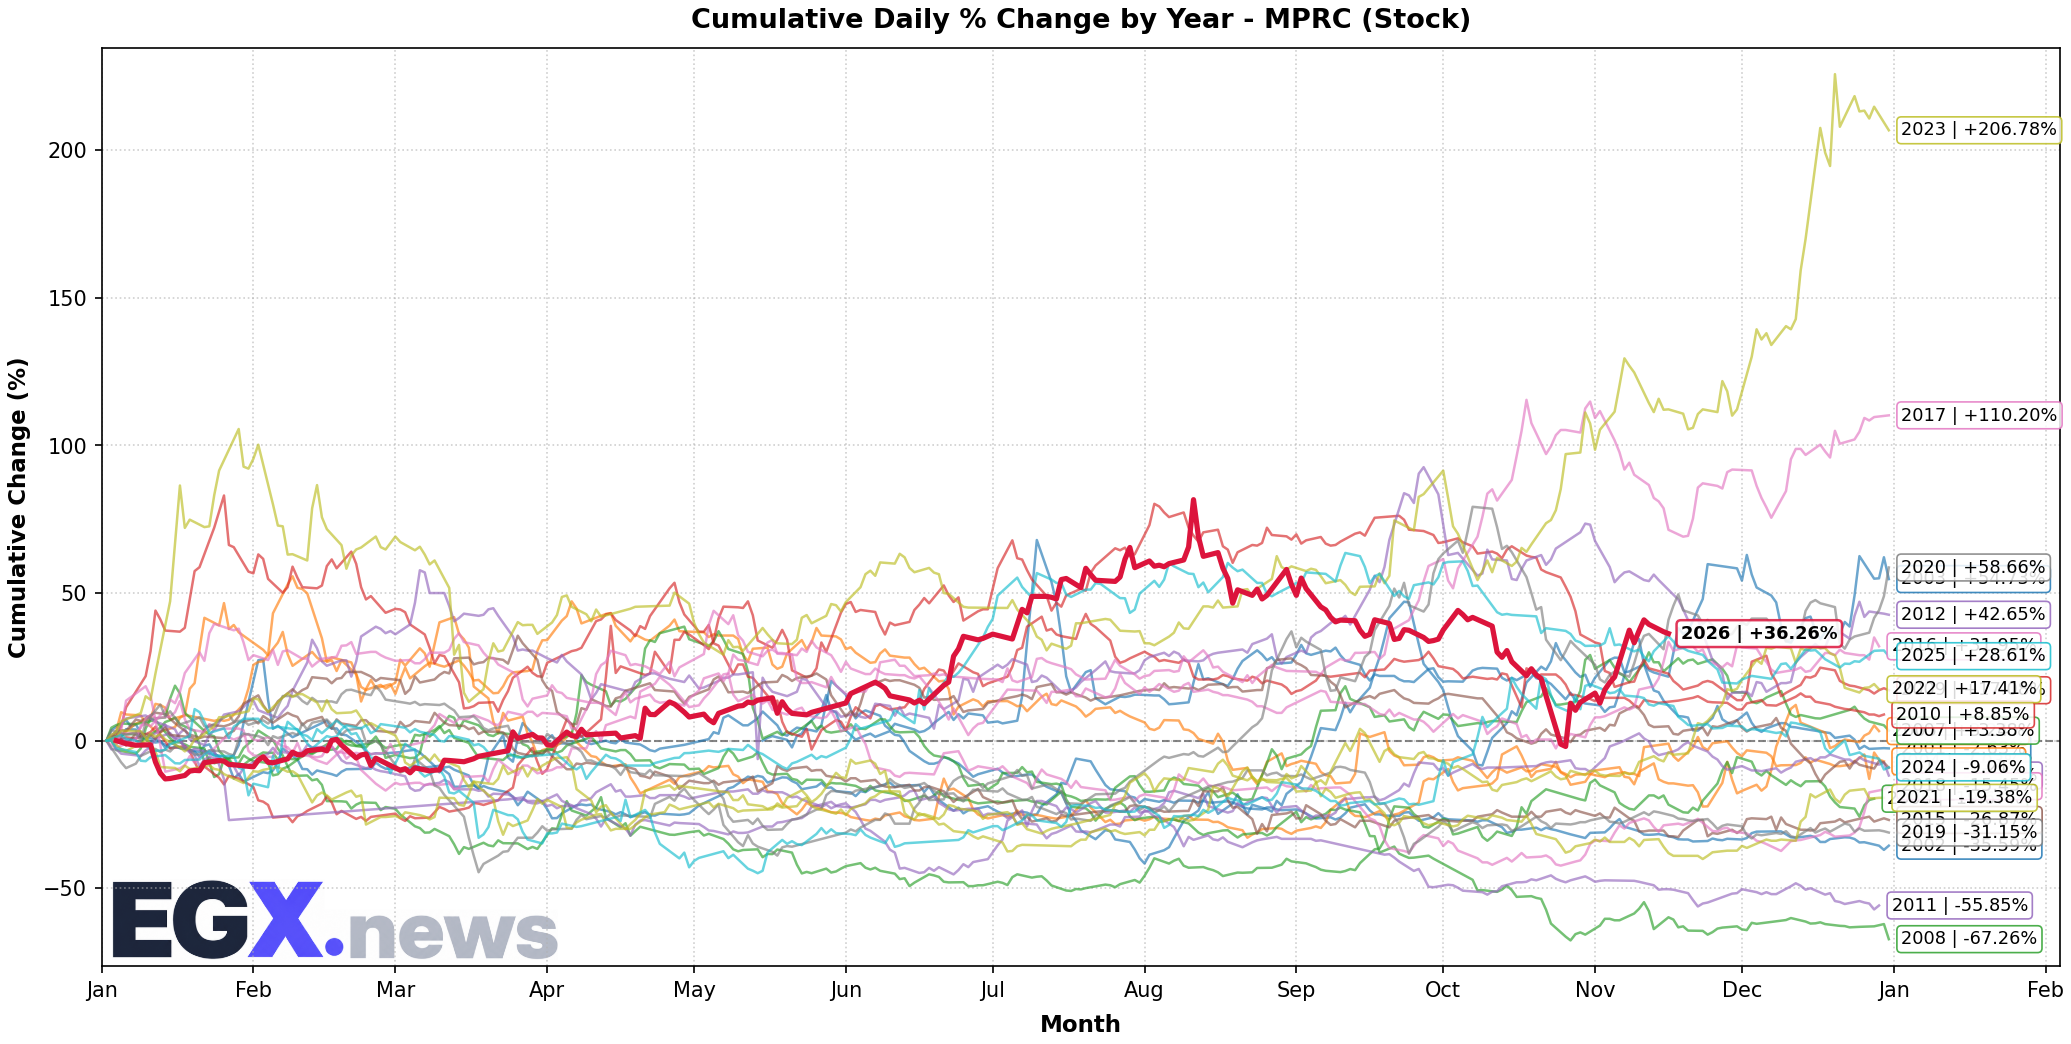
Seasonal Trend & Historical Patterns (MPRC)
Click to EnlargeHistorical monthly seasonal return distribution and performance cycles for MPRC.
Trend Structure & Moving Averages
Golden Cross (108D)Trend Score is 65/100 with price trading 11.7% above its 20-day SMA and above the 200-day long-term benchmark (SMA50 is above SMA200 for 108 sessions).
Momentum, Volume Flow & Volatility
RSI(14) is 57.48 (Bullish Momentum), moving +0.20 over the past 5 sessions — indicating positive momentum in buyer territory. MACD line (0.742) is above signal line (-0.136) with a histogram of +0.877 (Bullish Momentum).
20-day annualized volatility is 96.04%, ATR(14) is 2.18 (5.64% of price), and price is trading in the middle channel (%B: 0.771, Bandwidth: 43.18%).
Statistical Backtests & Historical Win Rates
BacktestedEmpirical backtesting reveals that RSI oversold dips (<30) historically yield an average 20-day return of +0.46% with a 51.64% win rate (122 observations, Reliability: High), while volume spikes yield an average 20-day return of +3.08% (51.96% win rate).
Price sits 26.33% below All-Time High (52.49 set 67 sessions ago on 2026-08-11) and 26.33% below its 52-week high (52.49 on 2026-08-11).