


Egyptians
EHDREgyptians Housing Development & Reconstruction
Company Overview & Activities
العمل فى مجال التنمية العقارية و الاستثمار العقارى بغرض شراء الاراضى و بيعها و تقسيمها و بيعها أو تشييد مبانى عليها واقامة المرافق اللازمة لها بجانب اقامة مشروعات التوسع العمرانى والمدن الجديدة والمبانى والمساكن وخدماتها من اسواق تجارية واماكن ادارية وجراجات لتأجيرها أو بيعها بما يتفق والقواعد المعمول بها فى إطار احكام القانون رقم 159 لسنة 1981 0
EGS65341C017
1994-08-03
FRA Certified Auditor
Financial FAQ & Technical Outlook for Egyptians Housing Development & Reconstruction (EHDR)
Quantitative Technical Engine (EHDR)
Egyptians holds a Neutral technical posture (Overall Score: 52.2/100) with Trend Score 15/100, Momentum Score 80/100 (RSI 47.25 - Neutral), and Volume Score 70/100 (accumulating, 0.59x 20D baseline).
Support & Resistance Confluence Matrix
AlgorithmicNearest support is at 2.14 [Strength: 45.0/100, Tier 3 (Intraday 1-min)] (0.93% below price with a 100.0% confirmed bounce rate across 1 tests, Reliability: Low). Nearest resistance is at 2.19 [Strength: 45.0/100, Tier 3 (Intraday 1-min)] (1.39% above price with a 100.0% confirmed rejection rate across 1 tests, Reliability: Low).
Seasonal Trend & Historical Patterns (EHDR)
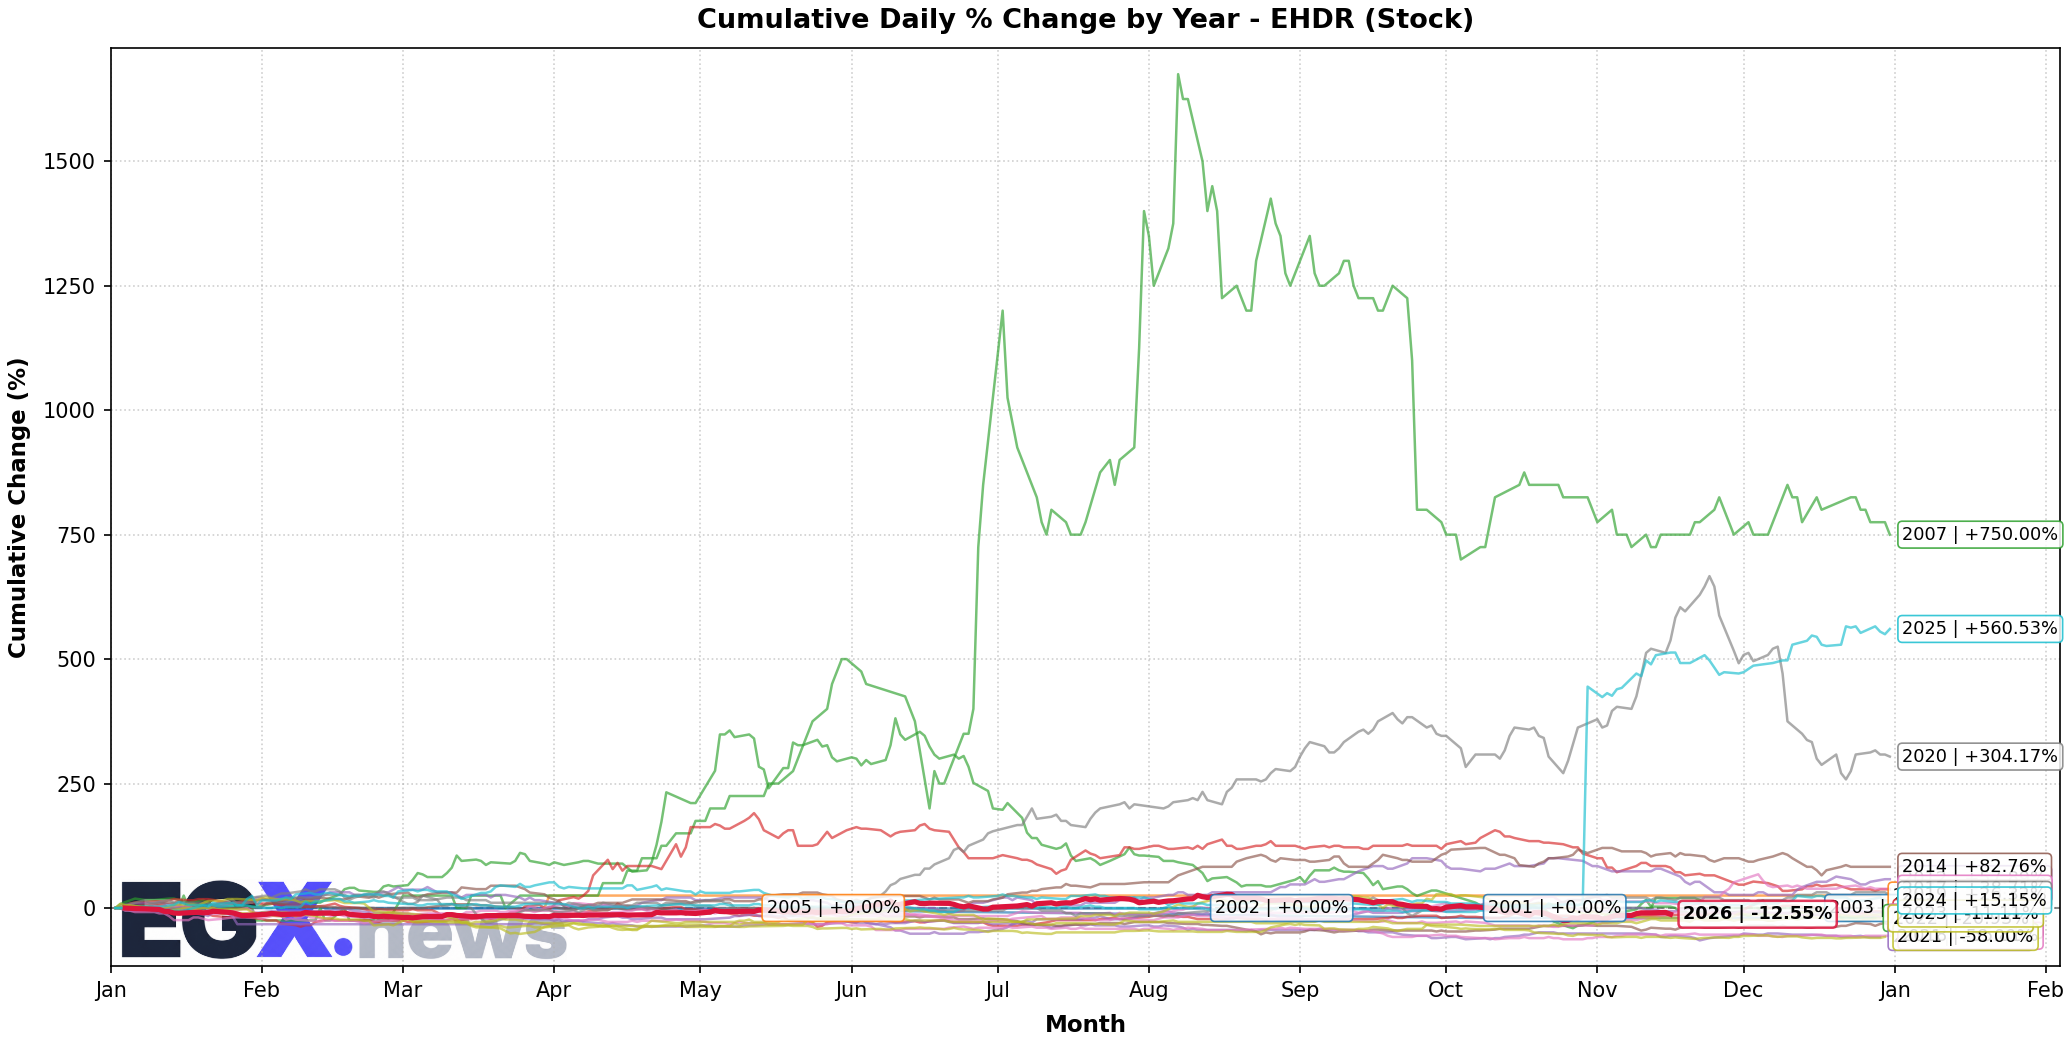
Click to EnlargeHistorical monthly seasonal return distribution and performance cycles for EHDR.
Trend Structure & Moving Averages
Trend Score is 15/100 with price trading 3.35% above its 20-day SMA and below the 200-day long-term benchmark (SMA50 is below SMA200).
Momentum, Volume Flow & Volatility
RSI(14) is 47.25 (Neutral), moving -2.54 over the past 5 sessions — indicating a balanced / consolidation posture. MACD line (-0.039) is above signal line (-0.082) with a histogram of +0.044 (Bullish Momentum).
20-day annualized volatility is 71.14%, ATR(14) is 0.11 (5.09% of price), and price is trading in the middle channel (%B: 0.636, Bandwidth: 26.32%).
Statistical Backtests & Historical Win Rates
BacktestedEmpirical backtesting reveals that RSI oversold dips (<30) historically yield an average 20-day return of +4.99% with a 58.2% win rate (122 observations, Reliability: High), while volume spikes yield an average 20-day return of +10.56% (48.15% win rate).
Price sits 32.5% below All-Time High (3.2 set 63 sessions ago on 2026-08-17) and 32.5% below its 52-week high (3.2 on 2026-08-17).